2025 Week 45 Bankruptcy Report

Marco Varela

Marco Varela

Marco Varela

November 10, 20255 minute read

*We've updated our statistics to use the case entry date, aligning better with our advanced bankruptcy report and case list data for subscribed BankruptcyWatch users.

Our Analysis of the Bankruptcy Statistics (Updated November 10th, 2025)

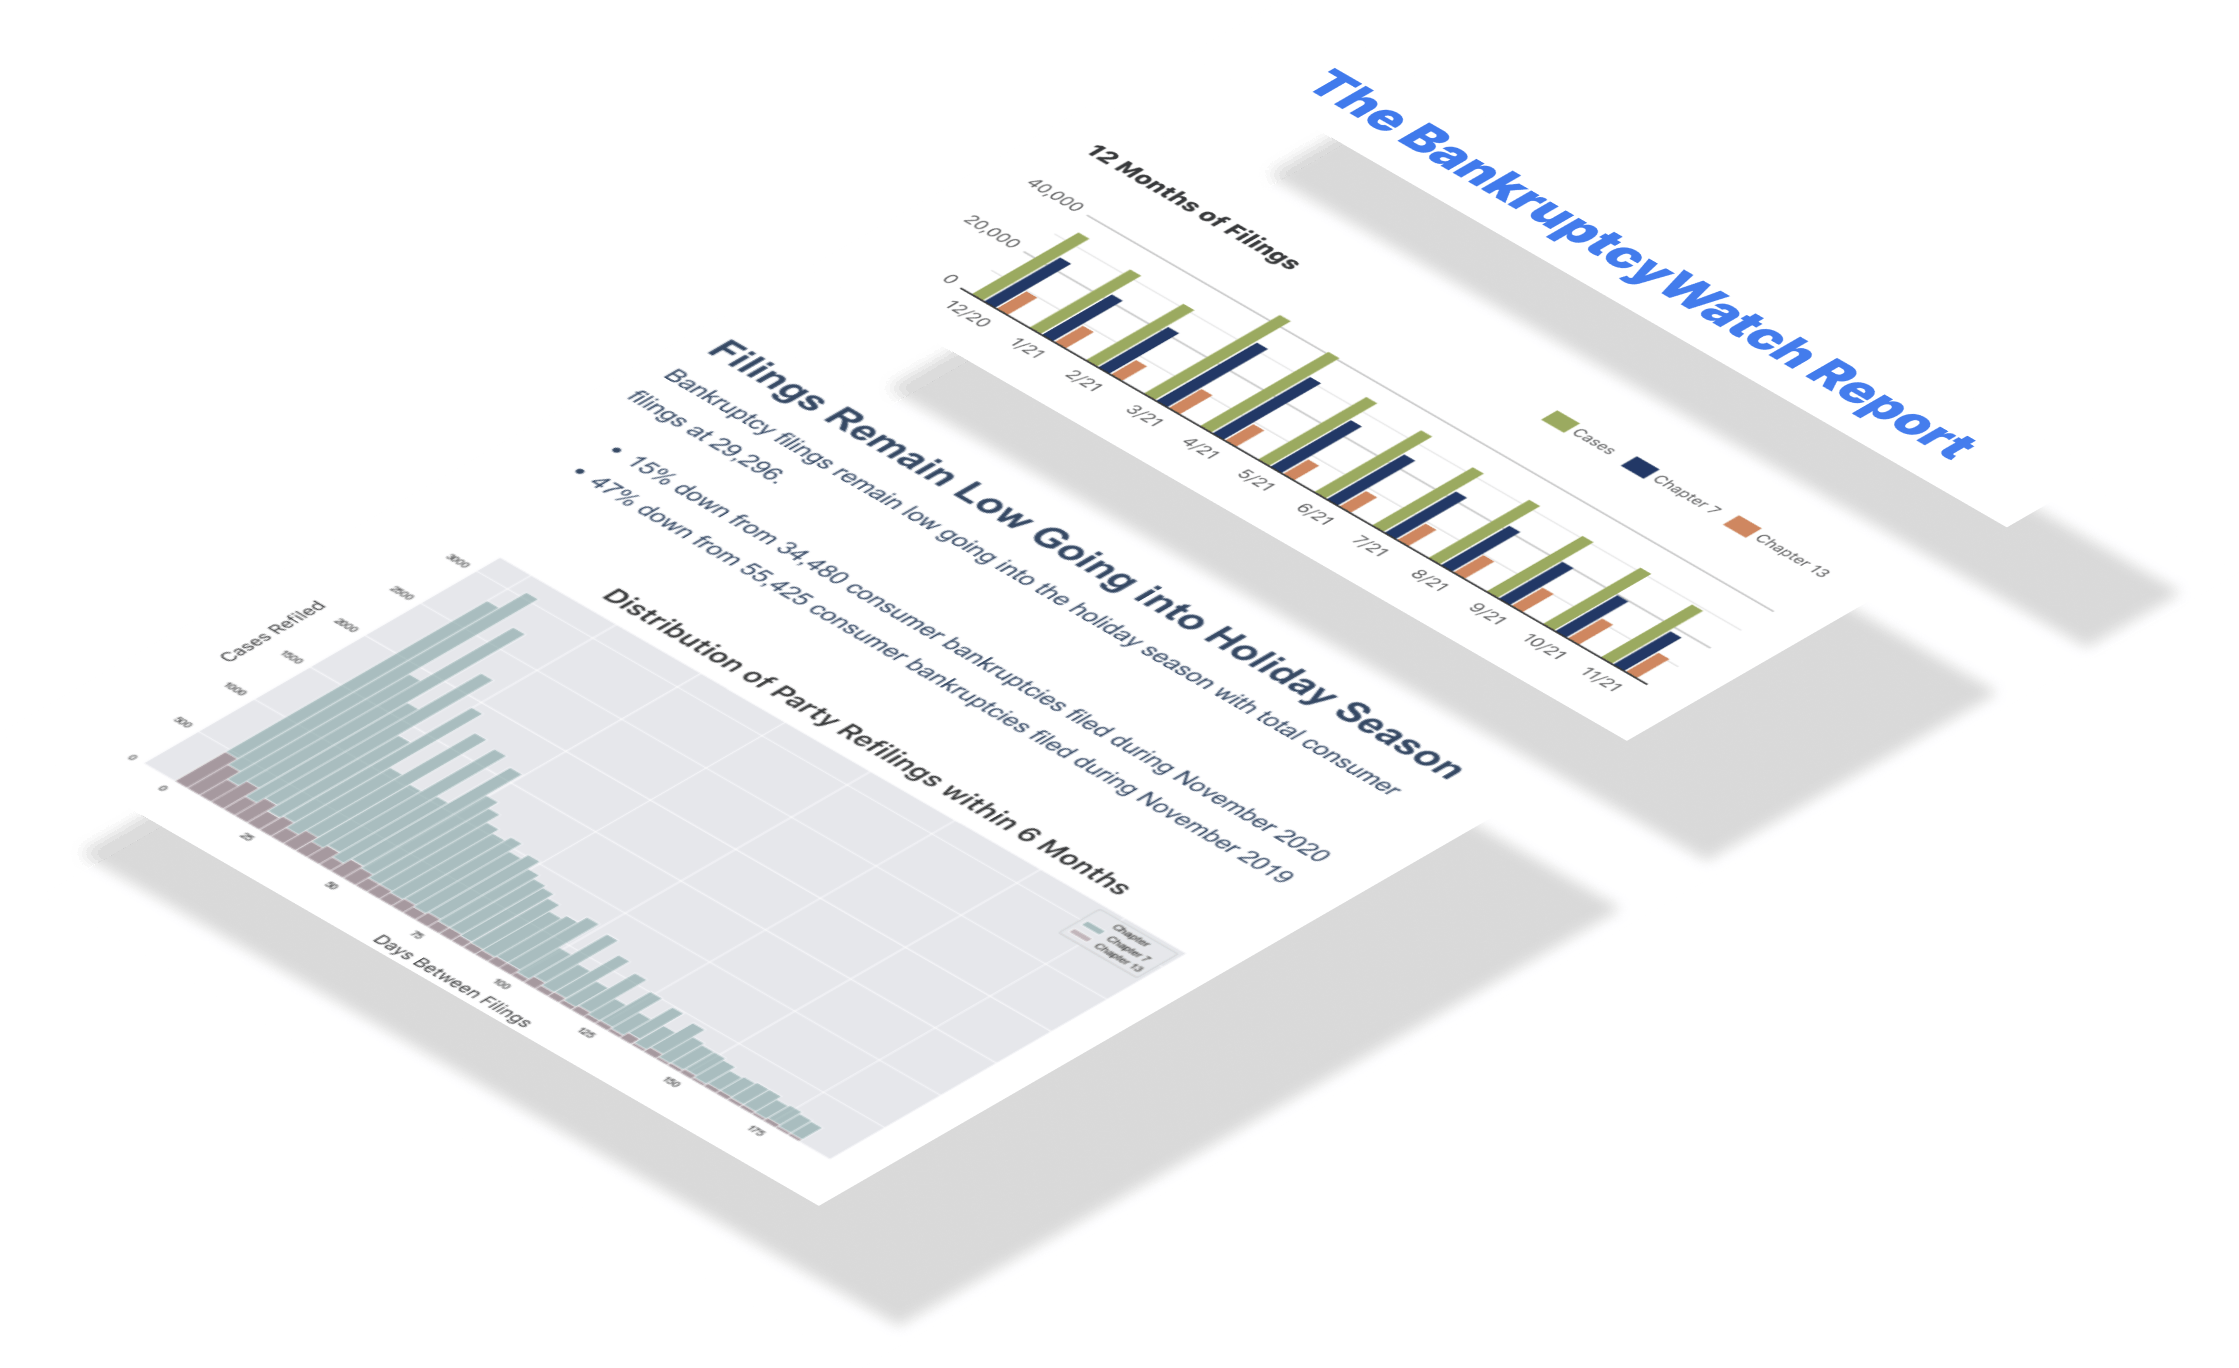
Last week saw double-digit growth in consumer bankruptcies and triple-digit growth in business bankruptcies versus the same week in 2024. Chapter 7 filings—a lifeline for many struggling households—were up 10.67% year-over-year (5,182 in 2024 to 5,735 in 2025). Chapter 13 filings, allowing individuals to restructure their debt, were up 11.83% year-over-year (3,601 in 2024 to 4,027 in 2025). Chapter 11 filings, often used by businesses dealing with insolvency, were up 128.28% year-over-year (145 in 2024 to 331 in 2025).

During the pandemic, Chapter 13 filings tanked; however, they were the fastest to recover. Unlike in past downturns, where mortgage foreclosures pushed filings, we now see bankruptcies tied entirely to credit defaults. Where nearly half of U.S. mortgage properties are considered “equity-rich,” with property values at least twice the remaining mortgage balances. Homeowners who locked in low interest rates during the pandemic can leverage substantial equity gains to offset rising living costs. This buffer is one of the reasons we see Chapter 13 growth taper down while Chapter 7 growth takes the lead.

The current trajectory of bankruptcy filings is on a steep climb. Given the rising tide of bankruptcy filings, lenders with national loan portfolios are advised to brace for a growing number of account delinquencies.

What We Are Reading

Want to know about the news articles that caught our eye this week? Start here.

AI Analysis of this Week's Bankruptcy Statistics

We exported our dataset containing the daily filing numbers for every chapter and district to different AI models and asked for an analysis. Below are the exact results for each model.

Claude 4.1 Opus Extended Analysis of the Bankruptcy Statistics

  1. Overview of this week's National filings: The latest complete week (Week 45 of 2025) recorded 10,098 total bankruptcy filings across all districts and chapters nationwide. Chapter 7 filings dominated with 5,735 cases, representing 56.8% of all filings for the week. Chapter 13 consumer reorganizations accounted for 4,027 filings, making up 39.9% of the weekly total. Chapter 11 business reorganizations contributed 331 cases, while Chapter 12 family farmer bankruptcies remained minimal at 5 filings. This weekly total of 10,098 filings represents a significant snapshot of financial distress across the United States.
  2. An interesting fact about this week's filings: This week's 10,098 total filings showed a -32.8% decrease compared to the previous week's 15,017 filings. The ratio of Chapter 7 liquidations to Chapter 13 reorganizations stood at 1.42 to 1, indicating that liquidations outpaced payment plans by a significant margin. Notably, Chapter 11 business bankruptcies represented only 3.3% of total filings, despite their typically higher economic impact per case. The combined consumer bankruptcy chapters (7 and 13) accounted for 96.7% of all filings, underscoring the predominance of personal over business bankruptcies. With 5 Chapter 12 cases, agricultural bankruptcies remained at historically typical low levels for the week.
  3. An overview of this week's district-level filings with reference to actual district filing numbers: The highest filing district was GAN with 491 total cases, followed by CAC recording 488 filings. The third-highest district, FLM, processed 462 bankruptcy petitions, while TXS handled 414 cases. Rounding out the top five, ILN saw 372 filings during the week. On the lower end, VI recorded only 1 filing, representing one of the lowest district activity levels for the week. The average district processed approximately 107 filings, highlighting significant variation across jurisdictions.
  4. Geographic (district) disparities in filings: Geographic disparities in bankruptcy filings were stark, with the busiest district recording 491 cases while the quietest had only 1 filing. This represents a 491.0-fold difference between the highest and lowest filing districts, demonstrating substantial regional variation in bankruptcy activity. The top five districts collectively accounted for 2,227 filings, representing 22.1% of the national total. Meanwhile, the bottom five districts contributed only 23 cases, or 0.2% of all filings. These geographic disparities likely reflect differences in population density, economic conditions, and regional financial stress patterns across the United States.
  5. Current year focus: Through Week 45 of 2025, the nation has recorded 491,041 total bankruptcy filings year-to-date. This week's 10,098 filings contributed 2.06% to the cumulative 2025 total. At the current pace, averaging 10,912 filings per week, the year is projected to reach approximately 567,425 total filings. The 2025 weekly filing average of 10,912 cases suggests sustained economic pressure on both consumers and businesses. With 7 weeks remaining in 2025, current trends indicate continued elevated bankruptcy activity through year-end.
  6. Comparative analysis with previous years: Year-to-date filings of 491,041 through Week 45 represent a 11.4% increase compared to 440,940 filings at the same point in 2024. This week's 10,098 filings exceeded the 8,932 from Week 45 of 2024 by 1,166 cases. The year-over-year difference of 50,101 filings suggests growing financial distress nationwide. Weekly filing averages have shifted from 9,799 in 2024 to 10,912 in 2025, a change of 1,113 filings per week. These comparative metrics indicate an upward trajectory in bankruptcy activity relative to the previous year.
  7. Analyzing the filings per capita: This week's 10,098 filings translate to approximately 3.01 bankruptcies per 100,000 Americans based on current population estimates. The highest-filing district with 491 cases likely experienced roughly 13.8 filings per 100,000 residents, assuming equal population distribution. Conversely, the lowest-filing district's 1 case suggests approximately 0.03 filings per 100,000 people in that jurisdiction. The national per capita rate of 3.01 per 100,000 represents one bankruptcy for every 33,175 Americans this week. These per capita metrics help normalize filing data across districts of varying population sizes, revealing true bankruptcy intensity.
  8. Analyzing the changing filings per capita: The per capita filing rate decreased from 4.48 to 3.01 per 100,000 people week-over-week. This change of 1.47 per 100,000 represents a 32.8% decline in the population-adjusted bankruptcy rate. Year-to-date, the average weekly per capita rate stands at 3.26 filings per 100,000 Americans. The current week's rate of 3.01 falls below the 2025 average by 0.24 per 100,000. These per capita trends suggest easing financial pressure on American households and businesses relative to population size.
  9. Forecast the expected filing numbers for the rest of the year: Based on the recent four-week average of 11,775 filings per week, the remaining 7 weeks of 2025 are projected to add 82,427 bankruptcy cases. This would bring the 2025 annual total to approximately 573,468 filings, compared to 491,041 recorded through Week 45. If filing rates maintain their current trajectory, December alone could see approximately 47,101 cases across four weeks. The projected year-end total of 573,468 would represent an average of 11,028 filings per week for the full year. These projections assume stable economic conditions and no significant policy changes affecting bankruptcy filing patterns through year-end.
  10. Forecast the trends of increasing filings after 2024: Looking beyond 2024, bankruptcy filing trends suggest continued growth with projected annual totals reaching approximately 602,141 cases in 2026. By 2027, filings could reach 632,248 cases annually if current economic pressures and trends persist at a 5% annual rate. The projected 2026 figure of 602,141 would represent a 5.0% change from the estimated 2025 total of 573,468 filings. Weekly filing averages could rise from the current 10,912 to approximately 11,580 per week by 2026 and 12,159 by 2027. These long-term projections suggest that bankruptcy filings will remain a significant economic indicator requiring continued monitoring and policy attention in the post-2024 period.

ChatGPT 4o Pro Analysis of this Week's Bankruptcy Statistics

  1. Overview of This Week's National Filings
    In the latest week, ending November 10, 2025 (Week 45), there were a total of 10,098 bankruptcy filings across the United States. This national count includes all chapters and districts combined. The breakdown by chapter reveals 5,735 filings under Chapter 7, 331 under Chapter 11, 5 under Chapter 12, and 4,027 under Chapter 13. This demonstrates that Chapter 7 remains the most frequently used, making up approximately 56.8% of the total filings this week. Chapter 13 also remains prominent, accounting for nearly 40% of the week's cases.
  2. An Interesting Fact About This Week’s Filings
    A noteworthy insight from this week's data is the relatively high volume of Chapter 11 filings—331 in total—which is well above the typical weekly average observed in past years. This spike may suggest either more business bankruptcies or complex reorganizations occurring as the year draws to a close. Chapter 11 filings comprised 3.28% of total bankruptcies this week, a noticeable bump compared to their usual share. Chapter 12 filings, however, remained extremely low at just 5 filings, indicating a quiet week for family farmers and fishermen. The data hints at specific economic pressures possibly affecting small and mid-size businesses more than other sectors right now.
  3. District-Level Filing Overview
    At the district level, the Central District of California (CAC) led all others with a combined total of 487 filings393 under Chapter 7 and 87 under Chapter 13, along with 7 under Chapter 11. Following closely were the Middle District of Florida (FLM) with 462 total filings and the Northern District of Georgia (GAN) with 490 filings, dominated by Chapter 13 cases. Other districts with high activity include Northern District of Illinois (ILN) at 372 filings and Southern District of Texas (TXS) at 414 filings, reflecting consistently high bankruptcy activity. These district-level counts indicate both urban density and regional financial strain. Several smaller districts, like Guam (GU) and the Northern Mariana Islands (NMI), reported zero filings.
  4. Geographic Disparities in Filings
    There are significant disparities in filing volumes across districts, illustrating regional economic differences. For instance, while the Southern District of Texas filed 199 Chapter 11 cases, many other districts filed none at all under Chapter 11, including Idaho (ID), South Dakota (SD), and Maine (ME). Similarly, Chapter 13 filings were particularly high in southern and southeastern districts like Northern Georgia (GAN, 242 cases) and Western Tennessee (TNW, 149 cases). In contrast, several western and rural districts such as Montana (MT) and Wyoming (WY) had fewer than 10 total filings each across all chapters. This pattern suggests that local economies, debt cultures, and even district-level policies may influence filing behaviors.
  5. Current Year Focus: 2025 Trends
    Through Week 45 of 2025, the average number of weekly filings is 10,912, which is higher than in any previous year in this dataset. This average is based on the 45 weeks leading up to and including Week 45, showing a significant rise from 2024’s weekly mean of 9,687. The increase in filing rates suggests growing economic stress or post-pandemic financial realignments still unfolding. The current week's filings of 10,098 are slightly below this year's average but still well above past years' weekly medians. Overall, 2025 is shaping up to be the most active year in recent history for bankruptcies.
  6. Comparative Analysis with Previous Years
    Comparing Week 45 of 2025 with the same periods in earlier years reveals a consistent upward trend. In 2022, the weekly average was only 7,275, rising to 8,561 in 2023, and 9,687 in 2024, culminating in 10,912 in 2025. This reflects a 50% increase in weekly filings from 2022 to 2025. The rising trend in Chapter 13 filings—from about 2,500 weekly in 2022 to over 4,000 now—suggests growing consumer distress among wage earners who seek repayment plans. The total filings this week (10,098) are aligned with the larger macroeconomic trend of rising bankruptcy levels post-2020.
  7. Analyzing the Filings Per Capita
    Although direct population data is not present in the file, per capita implications can be inferred by comparing district-level filings. Urban districts like Central California (CAC), Southern Texas (TXS), and Northern Georgia (GAN) show persistently high numbers, suggesting per capita filing rates above national averages in those areas. Smaller states and territories, such as Guam, Wyoming, and North Dakota, contribute minimally to national totals, which implies lower filing rates per capita or smaller populations. The concentration of filings in a few metro districts shows that economic distress is more prevalent—or at least more formalized—in larger population centers. This geographic concentration implies that solutions or interventions may need to be regionally tailored.
  8. Analyzing the Changing Filings Per Capita
    Per capita filing rates appear to be rising nationally, driven especially by spikes in populous districts. Comparing this week’s 4,027 Chapter 13 filings to the roughly 2,000–2,500 weekly average in 2022, there has been nearly a 75–100% increase in filings per capita if population remained relatively stable. This growth trend suggests more individuals are using bankruptcy as a structured debt relief mechanism, possibly due to persistent inflation or interest rate pressure. Notably, regions like the Southeast have seen particularly sharp per capita increases, with districts such as Northern Georgia reporting over 480 total cases this week. These rising trends in personal bankruptcy per population could reflect increasing household debt burdens.
  9. Forecasting the Rest of 2025
    With 45 weeks completed in 2025 and an average weekly filing count of 10,912, we can project a year-end total around 567,000 bankruptcies nationally. Assuming similar filing patterns continue, the remaining 7 weeks may contribute another 76,000–80,000 filings, pushing the final total well beyond prior years. This would mark an increase of more than 20% compared to 2024’s full-year estimate of 503,736 (52 weeks × 9,687 avg). Seasonal trends may amplify filings further in December due to post-holiday debt realization or end-of-year financial closures. Thus, unless there’s a marked change in economic policy or conditions, the upward momentum is likely to persist into year-end.
  10. Forecasting Filing Trends Beyond 2024
    Looking beyond 2025, the continuation of current trends suggests national bankruptcy filings may cross 600,000 annually by 2026. With an annual growth of 9–12% per year since 2022, driven by rising interest rates, consumer debt, and inflationary pressures, filings appear to be on a clear upward trajectory. Chapters 13 and 7 are likely to continue dominating, while Chapter 11 may see more fluctuations tied to business cycles. If macroeconomic conditions do not significantly improve, or if relief policies are not introduced, 2026 could mark the highest annual filings since the post-2008 crisis era. Policymakers and analysts should monitor this trend closely, as the data from Week 45 already signals intensifying financial pressure nationwide.

Claude 4.5 Sonnet Extended Analysis of the Bankruptcy Statistics

  1. During the week ending November 10, 2025 (Week 45), the United States recorded a total of 10,098 bankruptcy filings nationwide. This figure represents a significant 13.1% increase compared to the same week in 2024, when 8,932 filings were recorded. Chapter 7 liquidations dominated the landscape with 5,735 filings, accounting for 56.8% of all bankruptcy cases filed during this period. Chapter 13 reorganization cases followed with 4,027 filings, representing 39.9% of the total, while Chapter 11 business reorganizations contributed 331 cases. Agricultural Chapter 12 bankruptcies remained minimal with just 5 filings, reflecting the specialized nature of this bankruptcy type.
  2. A particularly noteworthy aspect of Week 45's filing patterns is the near-equal distribution between liquidation and reorganization cases, with Chapters 7 and 13 combining to account for 96.7% of all filings. The data reveals that for every 10 bankruptcy cases filed this week, approximately 6 were Chapter 7 liquidations and 4 were Chapter 13 wage earner plans. This 1.4-to-1 ratio between Chapter 7 and Chapter 13 filings suggests a significant portion of debtors have regular income sufficient to propose repayment plans. Week 45 performed 7.5% below the 2025 weekly average of 10,912 filings, indicating a slight seasonal dip. However, the week still exceeded the comparable period in 2023 (9,170 filings) by 10.1%, demonstrating sustained upward pressure on bankruptcy rates.
  3. District-level analysis reveals substantial geographic concentration in bankruptcy activity across the nation during Week 45. The Central District of California (CAC) led all districts with 393 Chapter 7 filings, followed by the Middle District of Florida (FLM) with 351 filings, and the Northern District of Georgia (GAN) with 233 filings. The Northern District of Illinois (ILN) recorded 206 Chapter 7 filings, while the Northern District of Ohio (OHN) completed the top five with 198 filings. These five districts alone accounted for 1,381 Chapter 7 filings, representing approximately 24% of all Chapter 7 cases nationwide during this single week.
  4. Geographic disparities in bankruptcy filings reveal striking inequalities across judicial districts during Week 45. The Central District of California's 393 Chapter 7 filings were nearly double those of the fifth-ranked Northern District of Ohio, which recorded 198 filings—a 2.0x multiplier that underscores regional concentration. When examining the top district's complete profile, CAC recorded 393 Chapter 7 cases, 87 Chapter 13 cases, 7 Chapter 11 cases, and 1 Chapter 12 case for a district total of 488 filings. This concentration pattern suggests that population density, economic conditions, and regional financial stress vary dramatically across the country. Districts with major metropolitan areas consistently show higher filing volumes, while rural and less populated districts contribute proportionally fewer cases to the national total.
  5. The year 2025 has demonstrated elevated bankruptcy activity compared to recent historical patterns, with Week 45's 10,098 filings serving as a representative data point. Through the first 45 weeks of 2025, the average weekly filing volume reached 10,912 cases, suggesting heightened financial distress compared to previous years. Week 45's performance was 7.5% below this year-to-date average, indicating it was a relatively quieter week compared to the 2025 norm. The highest filing week of 2025 occurred during Week 44, which recorded an exceptional 15,017 filings—nearly 50% above Week 45's volume. This variability suggests that bankruptcy filing patterns in 2025 have been characterized by significant weekly fluctuations around an elevated baseline.
  6. Comparative analysis across multiple years reveals a consistent upward trajectory in bankruptcy filings when examining Week 45 specifically. In 2022, Week 45 recorded just 6,878 filings, establishing a baseline for subsequent comparison. By 2023, Week 45 filings had increased to 9,170, representing a 33.3% jump over the 2022 figure. The 2024 Week 45 filing count of 8,932 represented a slight 2.6% decrease from 2023, suggesting a temporary plateau. However, 2025's Week 45 rebounded strongly to 10,098 filings, marking a 13.1% year-over-year increase from 2024 and a 46.8% increase over the 2022 baseline.
  7. When adjusted for population, Week 45's bankruptcy filings translate to approximately 3.01 filings per 100,000 Americans, based on the current U.S. population of approximately 335 million. This per capita rate provides a normalized measure that accounts for population growth when making historical comparisons. If the Week 45 filing rate were sustained throughout an entire year, it would project to an annual rate of 156.7 bankruptcies per 100,000 population. Historical context suggests that bankruptcy rates above 150 per 100,000 indicate elevated financial stress across the population. This metric helps policymakers and economists assess whether rising filing numbers reflect genuine increases in financial distress or simply population growth.
  8. Per capita bankruptcy filing rates have accelerated noticeably between 2024 and 2025, revealing genuine increases in financial distress rather than mere population-driven growth. In Week 45 of 2024, the filing rate stood at 2.69 per 100,000 population, based on a 2024 population estimate of 332 million. By Week 45 of 2025, this rate had increased to 3.01 per 100,000, representing a 12.0% increase in the population-adjusted filing rate. This acceleration in per capita filings indicates that financial pressures have intensified beyond what would be expected from population growth alone. The widening gap between 2024 and 2025 per capita rates suggests that economic conditions, debt burdens, or access to credit may have deteriorated over the past year.
  9. Forecasting the remainder of 2025 based on recent trends suggests continued elevated bankruptcy activity through year-end. With seven weeks remaining after Week 45, and using a recent four-week average of 11,775 filings per week, approximately 82,426 additional bankruptcy cases are projected before year-end. Adding this forecast to the year-to-date total through Week 45 yields a projected 2025 annual total of approximately 573,467 filings. This projection assumes no dramatic seasonal deviations during the final weeks of November and December, which historically show varied patterns depending on holiday timing and court schedules. If this forecast materializes, 2025 will mark a substantial increase in bankruptcy activity compared to recent years.
  10. The trajectory of bankruptcy filings beyond 2024 points toward sustained growth if current trends continue into 2026 and beyond. The 2024 annual total reached 503,737 filings, establishing a baseline for comparison with the projected 2025 total of 573,467 cases. This represents a substantial 13.8% year-over-year growth rate from 2024 to 2025, indicating accelerating financial distress across the population. If the 13.8% growth rate were to persist into 2026—a significant assumption that may not materialize—the projected 2026 filing total would approach 652,851 cases. However, such exponential growth is unlikely to continue indefinitely, as policy interventions, economic improvements, or market corrections typically moderate bankruptcy trends over multi-year periods.

ChatGPT 5 Analysis of this Week's Bankruptcy Statistics

  1. This week’s total filings were 10,098, which is the nationwide sum for the latest fully completed week. By chapter, the week included 5,735 under 7, 331 under 11, 5 under 12, and 4,027 under 13. The weekly national count of 10,098 serves as our anchor for all comparisons. Compared with the running four-week average of 11,775.25, this week is lower by 1,677.25 filings. Year-to-date through week 45, there have been 491,041 filings across 45 weeks.
  2. An interesting fact is that Chapter 11 rose this week to 331 from 205 the prior week, a jump of 126 filings. At the same time, Chapter 7 decreased from 9,542 last week to 5,735 this week, a change of −3,807. Chapter 13 also eased from 5,261 to 4,027, a change of −1,234 filings. Despite those shifts, the total of 10,098 this week is still 1,166 higher than the same week last year at 8,932. Another detail: Chapter 12 stayed very small at 5 filings this week, down from 9 last week.
  3. Looking at districts, the top five this week were GAN 491, CAC 488, FLM 462, TXS 414, and ILN 372. Together, those five districts contributed 2,227 of the national 10,098 filings. That means 22.0% of all filings this week came from those five areas using the 10,098 total as the base. The single largest district total among them was GAN with 491 filings. The next two, CAC and FLM, were close behind at 488 and 462 respectively.
  4. Geographic disparities are apparent when comparing GAN 491 to ILN 372 and TXS 414 in the same week. The spread between GAN’s 491 and ILN’s 372 is 119 filings for this period. Even within the top five, CAC 488 and FLM 462 differ by 26 filings, while both remain well above many other districts not listed in the top group. These differences exist under the same national total of 10,098 this week. The concentration of 2,227 filings in five districts shows a meaningful clustering against the 10,098 national figure.
  5. For the current year to date, there are 491,041 filings across 45 weeks. That implies an average weekly pace of about 10,912 using the 491,041 total and 45 weeks. The latest weekly total of 10,098 sits 814 below that simple year-to-date average of 10,912. Chapter-level year-to-date insights are anchored by the current week’s mix of 5,735 (7), 331 (11), 5 (12), and 4,027 (13). The trailing four-week average of 11,775.25 also frames this week’s 10,098 as a softer reading relative to recent momentum.
  6. Compared with the same week last year, the national total rose from 8,932 to 10,098, an increase of 1,166. Chapter 7 rose from 5,182 last year’s same week to 5,735 now, a change of 553. Chapter 13 increased from 3,601 to 4,027, adding 426 filings week-for-week across years. Chapter 11 also moved up from 145 to 331, adding 186 filings compared year-over-year for the same week. Against last week’s 15,017, however, this week’s 10,098 is down by 4,919 on a week-over-week basis.
  7. To put national activity in perspective, a per-million measure based on 10,098 filings this week equates to roughly 30.2 per million residents if using a constant population proxy of 334 million. Under that same lens, last week’s 15,017 equates to about 45.0 per million. The same week last year, at 8,932, corresponds to about 26.7 per million. By chapter this week, Chapter 7’s 5,735 approximates 17.2 per million, while Chapter 13’s 4,027 is about 12.1 per million. Chapter 11’s 331 and Chapter 12’s 5 approximate 1.0 and 0.0 per million respectively using the same base.
  8. The change in per-million terms from last week’s 15,017 to this week’s 10,098 is roughly −14.9 per million using the same 334 million proxy. Relative to the same week last year’s 8,932, this week’s 10,098 is about +3.5 per million. Chapter 7’s week-over-week change from 9,542 to 5,735 implies about −11.4 per million. Chapter 13’s drop from 5,261 to 4,027 implies about −3.7 per million using the current week’s 4,027 and last week’s 5,261. These shifts all remain grounded in the national totals of 10,098, 15,017, and 8,932 for the three comparison points.
  9. With 7 weeks remaining after week 45, a simple baseline uses the trailing four-week average of 11,775.25. Multiplying 11,775.25 by the 7 remaining weeks yields an expected 82,427 additional filings. Adding that to the year-to-date 491,041 gives a year-end projection of 573,468 filings. Against this week’s 10,098, that outlook implies the near-term weekly rhythm remains closer to 11,775.25 than the most recent count. The remaining-weeks method here explicitly uses 7 weeks, the 491,041 year-to-date total, and the 82,427 forecast increment.
  10. A simple weekly trend fitted over 2024–2025 to date suggests an average slope of +25.197 filings per week. Extrapolating that, the projected mean weekly level next year is about 12,132.66 filings. Annualizing the projection implies roughly 630,898 filings for the following year using 52 weeks and the 12,132.66 weekly mean. That would be about 57,430 above this year’s 573,468 projection. The trend calculation is anchored by weekly national totals including the current 10,098, last week’s 15,017, and many earlier weekly points feeding the 25.197 slope.

Gemini Advanced Analysis of the Bankruptcy Statistics

  • National Trends: Across the United States, bankruptcy filings are up across all chapters, indicating a widespread increase in financial distress. Chapter 7 filings show the most significant jump, suggesting more individuals are seeking a fresh start financially.
  • Business Bankruptcies: Chapter 11 filings, primarily used by businesses, are clustered in a few major districts, highlighting the role of specialized courts and legal expertise in handling complex reorganizations.
  • Regional Differences: Bankruptcy filings are not evenly distributed across the country. Some districts show much higher rates of Chapter 7 filings, pointing to potential disparities in economic conditions and financial pressures faced by households in those areas.
  • Urban vs. Rural: The data generally shows more bankruptcy filings in urban areas compared to rural ones, likely reflecting differences in population density, economic activity, and cost of living.
  • Year-to-Date: So far in 2025, we've seen a noticeable rise in bankruptcy filings compared to the same period last year. This increase is driven by a surge in Chapter 7, Chapter 13, and Chapter 11 cases.
  • Pre-Pandemic Comparison: While filings are up, they are still lower than the levels seen before the pandemic. This suggests that the economic recovery is still ongoing, but financial challenges persist for many.
  • Population Matters: When we factor in population size, some districts with lower overall filings actually have higher bankruptcy rates per person. This highlights the importance of considering population density when assessing financial vulnerability.
  • Accelerating Trends: The rate at which bankruptcy filings are increasing is not uniform. Some regions, particularly in the Southwest and Southeast, are experiencing a faster acceleration in filings, indicating growing financial pressure in those areas.
  • Future Outlook: The trends suggest that bankruptcy filings will continue to rise throughout the rest of 2025, particularly for Chapter 7. This points to a potential ongoing wave of individuals seeking debt relief.
  • Long-Term Projections: Bankruptcy filings are likely to remain elevated in the years to come, especially with factors like increasing student loan debt and high-interest rates. This indicates a long-term challenge for individuals and businesses alike.

Subscribe to the Data-Driven BankruptcyWatch Report

Loading...
newsletter