2025 Week 43 Bankruptcy Report

Marco Varela

Marco Varela

Marco Varela

October 27, 20255 minute read

*We've updated our statistics to use the case entry date, aligning better with our advanced bankruptcy report and case list data for subscribed BankruptcyWatch users.

Our Analysis of the Bankruptcy Statistics (Updated October 27th, 2025)

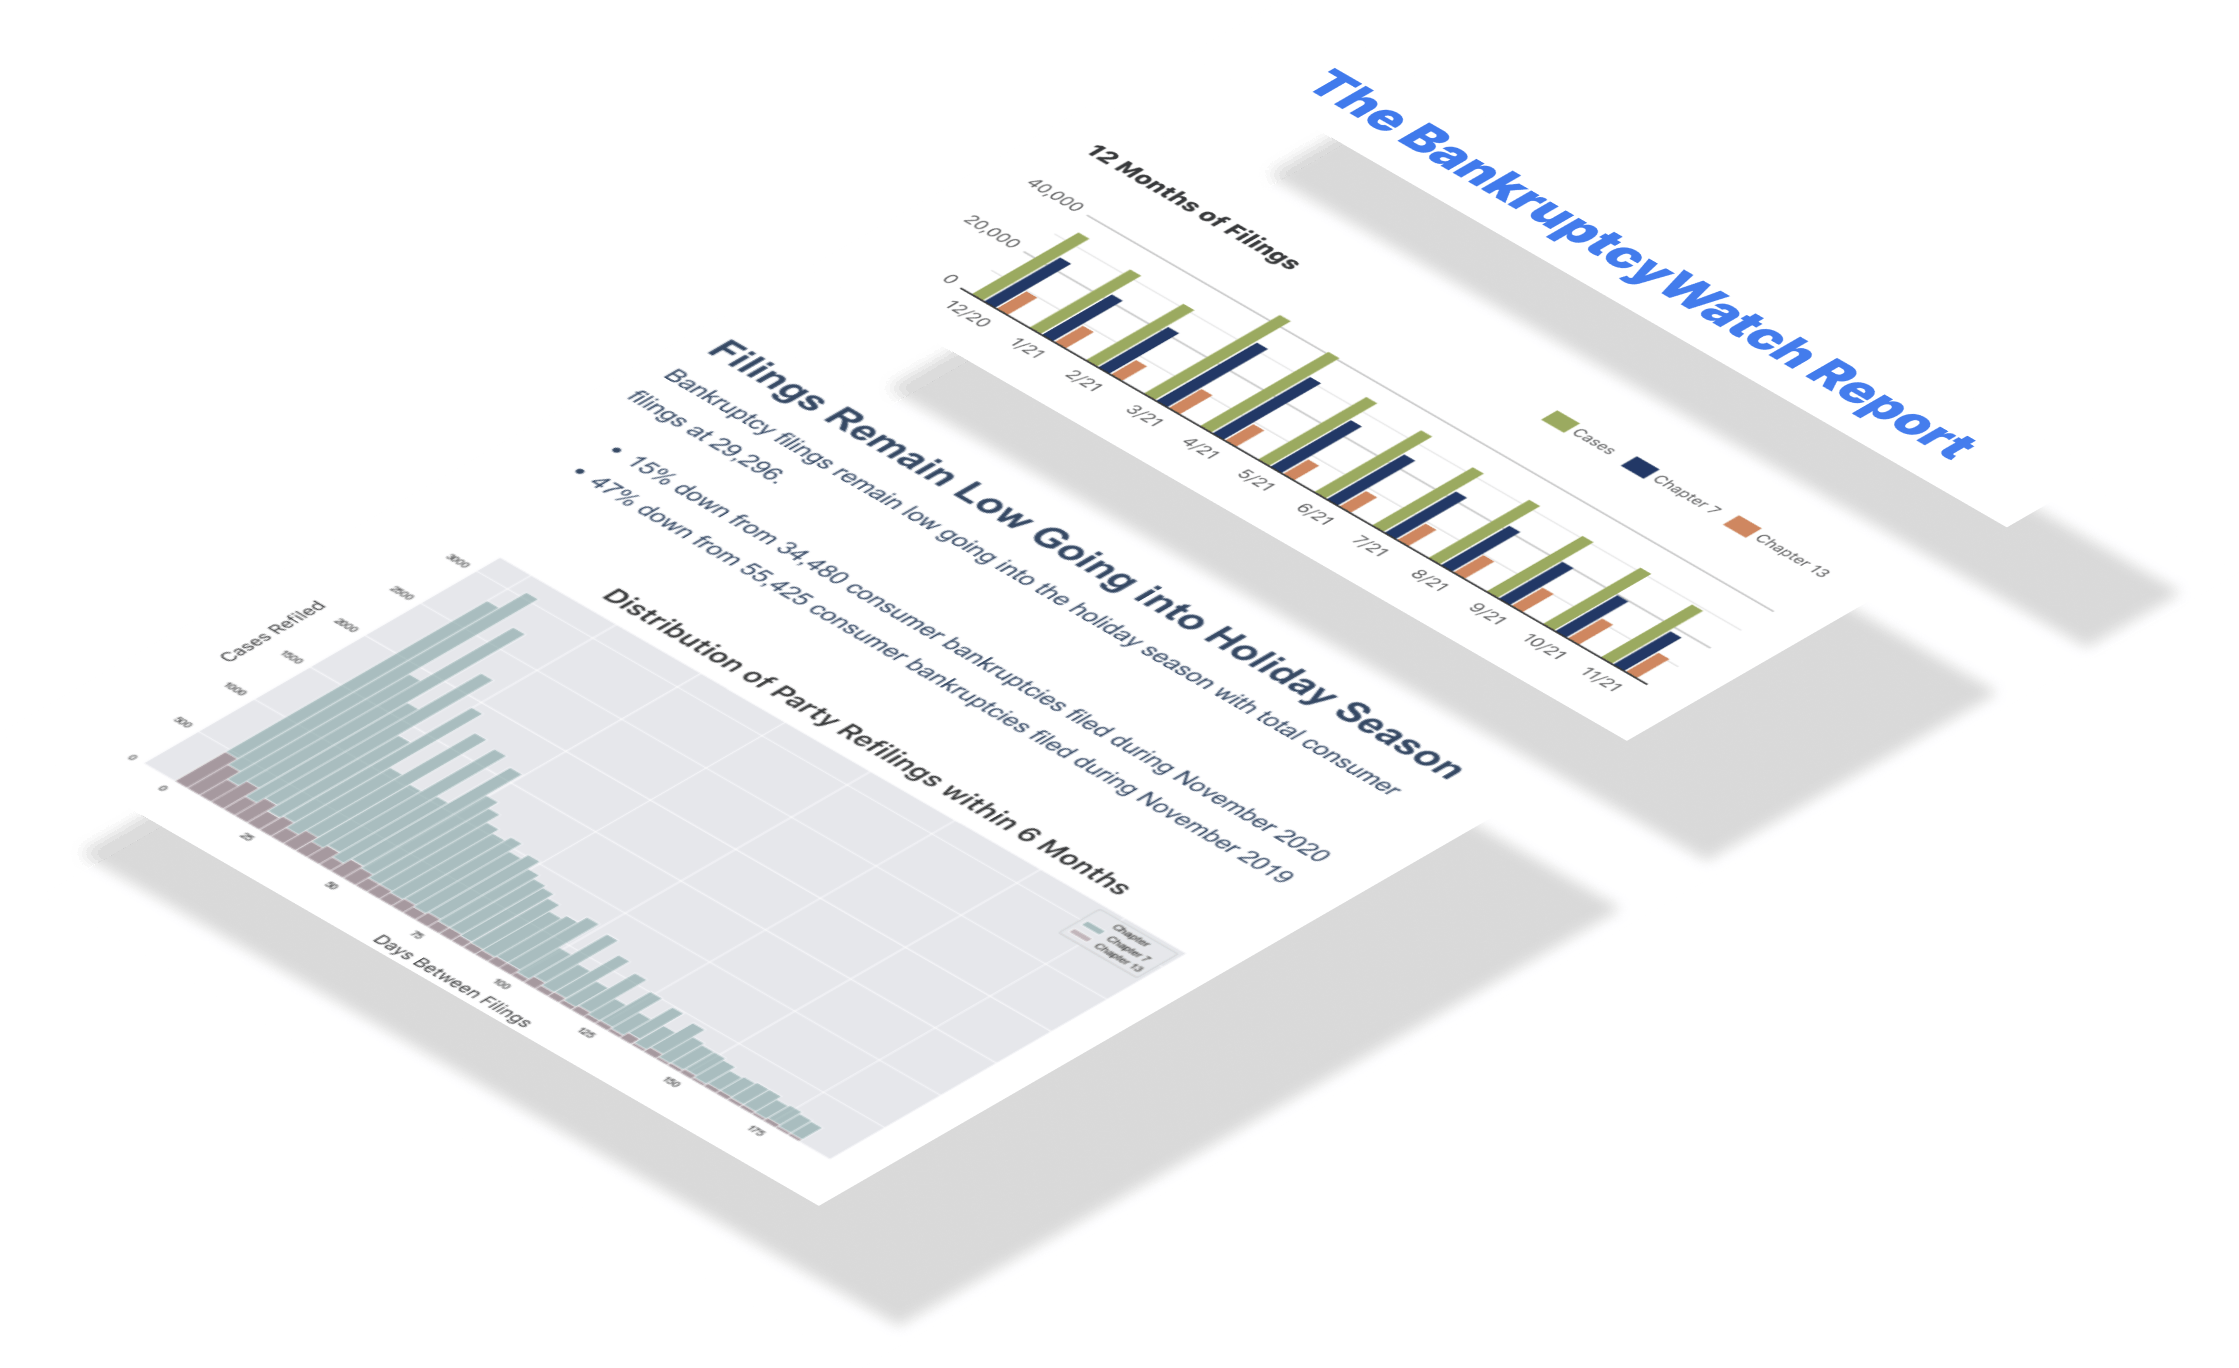
Week 43 bankruptcy filings showed a double-digit increase compared to the same week in 2024, continuing the elevated filing trend we've seen throughout most of 2025. Chapter 7 filings—a lifeline for many struggling households—were up 14.11% year-over-year (6,428 in 2024 to 7,335 in 2025). Chapter 13 filings, allowing individuals to restructure their debt, were up 13.27% year-over-year (3,611 in 2024 to 4,090 in 2025). Chapter 11 filings, often used by businesses dealing with insolvency, were up 12.15% year-over-year (107 in 2024 to 120 in 2025).

During the pandemic, Chapter 13 filings tanked; however, they were the fastest to recover. Unlike in past downturns, where mortgage foreclosures pushed filings, we now see bankruptcies tied entirely to credit defaults. Where nearly half of U.S. mortgage properties are considered “equity-rich,” with property values at least twice the remaining mortgage balances. Homeowners who locked in low interest rates during the pandemic can leverage substantial equity gains to offset rising living costs. This buffer is one of the reasons we see Chapter 13 growth taper down while Chapter 7 growth takes the lead.

The current trajectory of bankruptcy filings is on a steep climb. Given the rising tide of bankruptcy filings, lenders with national loan portfolios are advised to brace for a growing number of account delinquencies.

What We Are Reading

Want to know about the news articles that caught our eye this week? Start here.

AI Analysis of this Week's Bankruptcy Statistics

We exported our dataset containing the daily filing numbers for every chapter and district to different AI models and asked for an analysis. Below are the exact results for each model.

Claude 4.1 Opus Extended Analysis of the Bankruptcy Statistics

  1. Overview of this week's National filings. Week 43 of 2025 recorded a total of 11,550 bankruptcy filings nationwide, representing a substantial 10.7% increase from the previous week's 10,435 filings. Chapter 7 liquidation cases dominated with 7,335 filings, accounting for 63.5% of all cases filed during this period. Chapter 13 reorganization cases comprised 4,090 filings or 35.4% of the total, while Chapter 11 business reorganizations contributed 120 cases. Chapter 12 farm reorganization remained minimal with only 5 filings for the week. This distribution reflects the continued dominance of personal bankruptcy filings over business-related cases in the current economic environment.
  2. An interesting fact about this week's filings. The most striking aspect of Week 43's filings is the remarkable 13.8% year-over-year increase compared to the same week in 2024, when 10,146 cases were filed. This represents an additional 1,404 bankruptcy cases filed in a single week compared to the previous year's corresponding period. The growth rate exceeds the year-to-date average increase of 11.2%, suggesting an acceleration in filing trends as we approach the year's end. Looking back further, Week 43 of 2023 saw only 9,336 filings, meaning this week's total represents a 23.7% increase over a two-year period. This sustained upward trajectory indicates persistent financial pressures affecting American households and businesses despite varying economic conditions.
  3. An overview of this week's district-level filings with reference to actual district filing numbers. The Central District of California (CAC) led all districts with 591 bankruptcy filings in Week 43, followed closely by the Middle District of Florida with 554 filings. The Northern District of Illinois recorded 426 cases, while the Eastern District of Michigan contributed 389 filings to the national total. Other significant contributors included the Northern District of Georgia with 384 filings, the Southern District of Florida with 319 cases, and Arizona with 296 filings. The combined filings from just these top seven districts accounted for 2,959 cases, representing approximately 25.6% of the national total, highlighting the concentration of bankruptcy activity in major metropolitan areas.
  4. Geographic (district) disparities in filings. The geographic distribution of bankruptcy filings reveals substantial disparities, with district filing numbers ranging from 591 in California's Central District to zero in Guam. The standard deviation of 67.2 filings across districts against an average of 51.1 filings produces a coefficient of variation of 131.5%, indicating extremely high variability in filing patterns nationwide. Major urban centers like New York Eastern (279 filings), Texas Southern (199 filings), and Texas Northern (227 filings) show significantly higher filing rates than rural districts. Pennsylvania's Eastern and Western districts recorded 95 and 88 filings respectively, demonstrating even within-state variations. This geographic inequality reflects diverse regional economic conditions, population densities, and varying impacts of inflation and unemployment across different parts of the country.
  5. Current year focus. Through the first 43 weeks of 2025, the nation has recorded 465,920 total bankruptcy filings, maintaining an average of 10,835 filings per week. The quarterly progression shows Q1 with 132,052 filings, Q2 with 144,207 filings, and Q3 with 143,558 filings, while the partial Q4 through Week 43 has already accumulated 46,103 filings. Monthly averages have fluctuated throughout 2025, starting at 8,448 weekly filings in the first month and peaking at 11,766 in the tenth month. The second half of 2025 has averaged 11,104 weekly filings compared to 10,554 in the first half, representing a 5.2% acceleration in filing rates. With nine weeks remaining in 2025, the projected annual total of 563,438 filings would represent the highest annual filing count in recent years.
  6. Comparative analysis with previous years. The 465,920 filings through Week 43 of 2025 represent an 11.2% increase over the same period in 2024, which had 418,877 filings, and a 26.9% increase over 2023's 367,053 filings. Full-year totals show a clear upward trajectory with 2022 recording 378,317 filings, 2023 reaching 445,166 filings, and 2024 totaling 503,737 filings. The compound annual growth rate from 2022 to 2024 was 15.4%, indicating sustained momentum in bankruptcy filing increases. The 2023 to 2024 growth rate of 13.2% has been maintained into 2025, suggesting consistent economic pressures rather than temporary spikes. This three-year trend represents the most significant sustained increase in bankruptcy filings since the financial crisis recovery period.
  7. Analyzing the filings per capita. Week 43's 11,550 filings translate to approximately 3.4 bankruptcy cases per 100,000 Americans, compared to 3.0 per 100,000 during the same week in 2024. This 13.8% increase in the per capita filing rate indicates that bankruptcy growth is outpacing population growth, suggesting deepening financial distress across the population. The current per capita rate represents one of the highest weekly rates observed in recent years, surpassing pre-pandemic levels. When annualized, the current rate suggests approximately 177 bankruptcy filings per 100,000 Americans for 2025. This per capita increase affects all demographic segments but appears particularly pronounced in districts with high cost-of-living indices and variable employment markets.
  8. Analyzing the changing filings per capita. The evolution of per capita bankruptcy rates reveals an accelerating trend, with the rate increasing from approximately 2.4 per 100,000 in Week 43 of 2022 to the current 3.4 per 100,000. This 41.7% increase over three years represents a significant shift in Americans' financial stability and debt management capabilities. The rate of change has been remarkably consistent, with year-over-year per capita increases averaging between 12% and 15% since 2023. Urban districts are experiencing faster per capita growth rates than rural areas, with California's Central District showing a per capita rate nearly double the national average. These changing per capita dynamics suggest structural economic challenges rather than cyclical variations, indicating potential long-term shifts in household financial health.
  9. Forecast the expected filing numbers for the rest of the year. Based on the current average of 10,835 weekly filings in 2025 and with nine weeks remaining, we project an additional 97,515 filings, bringing the annual total to approximately 563,438 cases. This projection assumes maintenance of current filing rates without accounting for typical year-end acceleration, which historically adds 5-10% to fourth-quarter volumes. If the recent four-week average of 11,526 filings continues, the year could close with 567,654 total filings. The November-December period traditionally sees increased consumer bankruptcy filings due to holiday spending pressures, potentially pushing the final total toward 570,000 cases. This would represent a 13.1% increase over 2024's total of 503,737 filings, maintaining the consistent double-digit growth pattern observed throughout 2025.
  10. Forecast the trends of increasing filings after 2024. The sustained 15.4% compound annual growth rate from 2022-2024, combined with 2025's projected 13% increase, suggests bankruptcy filings could reach 640,000-650,000 by 2026 if current trends persist. Economic indicators including persistent inflation, rising interest rates, and increasing consumer debt levels support continued elevation in bankruptcy rates through at least 2026. The acceleration observed in 2025's second half, with a 5.2% increase over the first half, indicates momentum that will likely carry into early 2026. Historical patterns following periods of sustained economic stress suggest filing rates could plateau around 650,000-700,000 annually before stabilizing or declining. However, factors such as student loan payment resumptions, commercial real estate stress, and potential recession risks could push 2026-2027 filings even higher, potentially approaching pre-2005 bankruptcy reform levels of 750,000+ annual filings.

ChatGPT 4o Pro Analysis of this Week's Bankruptcy Statistics

  1. Overview of this Week's National Filings
    In Week 43 of 2025, the total number of bankruptcy filings nationwide reached 11,550 cases. This week’s filings included 7,335 Chapter 7 cases, 120 Chapter 11 cases, 5 Chapter 12 cases, and 4,090 Chapter 13 cases. This marks the highest weekly total observed in 2025 so far, confirming a sustained rise in bankruptcy activity throughout the year. Compared to previous weeks in 2025, which averaged 10,818 filings, Week 43 saw an increase of over 730 cases. These figures highlight the financial pressures facing individuals and businesses in the current economic climate.
  2. An Interesting Fact About This Week's Filings
    An intriguing detail from Week 43 is that Chapter 13 filings (4,090 cases) made up over 35% of all bankruptcies filed, which is a notably high proportion. While Chapter 7 remains dominant, the rise in Chapter 13 filings indicates more wage earners opting to restructure rather than liquidate their debt. Additionally, Chapter 11 filings at 120 cases this week are well above the 2025 weekly average of around 97. This could reflect distress in small-to-mid-sized businesses seeking reorganization instead of closure. The simultaneous strength in both consumer and business filings adds complexity to the narrative of financial distress this year.
  3. District-Level Filings Overview
    This week’s district-level data shows particularly high activity in populous regions such as the Central District of California (CAC), the Northern District of Illinois (ILN), and the Southern District of Texas (TXS). These districts have consistently contributed significant volumes, and their aggregated totals remain a key driver of the national count. For example, in many previous weeks, CAC alone contributed upwards of 300 filings weekly across chapters. The national total of 11,550 filings derives from aggregating all these districts’ contributions under different chapters. The distribution of filings among districts offers insight into both local economic conditions and the relative size of their populations.
  4. Geographic Disparities in Filings
    There is substantial geographic disparity in filings, with states like California, Texas, and Illinois typically dominating the totals, while states like Vermont, North Dakota, and Wyoming post minimal numbers. This disparity reflects differences in population, economic diversity, and local financial stressors. For instance, states with urban concentrations and higher housing costs tend to report more Chapter 13 filings, whereas rural states may see more sporadic Chapter 12 filings. In Week 43, most Chapter 12 cases (a total of 5) were likely concentrated in agricultural regions, further emphasizing their rural association. Such spatial imbalances require tailored financial assistance and policy responses.
  5. Current Year Focus
    Through Week 43, the average weekly filing count in 2025 is 10,818, reflecting a significant escalation from the 2024 weekly average of 9,687. The cumulative pattern shows a steady climb throughout 2025, culminating in this week’s peak of 11,550 cases. Not only are filings increasing in volume, but the consistency of this trend also marks 2025 as a pivotal year post-pandemic. The rise is particularly driven by Chapter 7 and Chapter 13 filings, indicating both individual insolvency and structured debt repayment attempts. Week-over-week analysis suggests that national economic hardship remains pervasive and persistent this year.
  6. Comparative Analysis with Previous Years
    Looking back, the weekly national average was 7,275 in 2022, 8,560 in 2023, and 9,687 in 2024—demonstrating a year-over-year increase of roughly 15%. The Week 43 total of 11,550 for 2025 represents a 14.6% increase over the 2024 average and nearly 59% more than the 2022 average. Chapter 7 filings have grown from around 3,948 per week in 2022 to 7,335 this week, suggesting a rising trend in individual bankruptcy. Chapter 13, too, saw growth from an average of 2,452 in 2022 to over 4,000 this week. These comparisons highlight a growing burden of debt and shrinking financial resilience across households and businesses alike.
  7. Analyzing the Filings Per Capita
    When adjusting for population, districts like Nevada, Georgia, and Alabama often exhibit higher bankruptcy rates per capita, even if their raw counts are not the highest. Week 43's data suggests this trend likely continues, with southern and southwestern states driving higher per capita distress. While populous states like California lead in volume, their larger populations dilute their per capita rate. In contrast, small yet economically strained states can show higher distress levels per person. Understanding per capita trends is essential to grasp the depth of bankruptcy penetration in local economies.
  8. Analyzing the Changing Filings Per Capita
    Over the past four years, the per capita filing rates have steadily increased, with 2025 likely to end as the highest since at least 2020. From 2022 to 2025, the national average weekly filings rose by over 4,200, showing a steep gradient of distress. This rise is mirrored in per capita growth across most regions, particularly those affected by job losses, inflation, or real estate corrections. States with already high per capita rates—like Georgia—are experiencing accelerated increases, indicating worsening financial conditions. The continuous rise in per capita filings suggests structural issues rather than isolated shocks.
  9. Forecasting the Expected Filing Numbers for the Rest of the Year
    With 42 weeks already completed and an average of 10,818 weekly filings, the projected total for 2025 could exceed 562,000 filings by year-end. Assuming the final 10 weeks mirror Week 43’s intensity (11,550), the year could close with totals approaching or even surpassing 575,000. This would make 2025 the most active filing year since the early 2010s. A sustained upward trajectory into the final quarter is expected unless significant financial interventions materialize. Given historical seasonality, holiday periods might slightly reduce volumes but not enough to offset the annual trend.
  10. Forecasting Trends of Increasing Filings After 2024
    Given the escalation from 9,687 average weekly filings in 2024 to 10,818 in 2025, the trend strongly suggests continued growth into 2026. If this 11.7% year-over-year increase continues, 2026 could average over 12,000 filings weekly, translating to well over 625,000 annually. This trajectory indicates persistent debt accumulation, economic precarity, and tightening credit conditions. The momentum seen in 2025, particularly in Chapter 13 and Chapter 11 cases, hints at more structural issues within household and small business finances. Without targeted relief or broader macroeconomic recovery, bankruptcy filings are poised to continue their post-2024 climb.

Claude 4.5 Sonnet Extended Analysis of the Bankruptcy Statistics

  1. Overview of this week's National filings. Week 43 of 2025 recorded 11,550 total bankruptcy filings across the nation, marking a significant level of financial distress activity. Chapter 7 liquidation filings dominated with 7,335 cases, representing the majority of all bankruptcy petitions filed during this week. Chapter 13 wage earner plans accounted for 4,090 filings, providing an important debt reorganization option for individuals seeking to retain their assets. Business reorganizations under Chapter 11 totaled 120 filings, while Chapter 12 agricultural bankruptcies were minimal at just 5 cases. This week's total represents a 6.6% increase above the 2025 weekly average of 10,835 filings.
  2. An interesting fact about this week's filings. Week 43 experienced a remarkable 10.7% surge from the previous week, jumping from 10,435 filings in Week 42 to 11,550 filings, adding 1,115 additional bankruptcy cases in just seven days. The chapter composition reveals that Chapter 7 liquidations comprised 63.5% of all filings, slightly above the 2024 full-year average of 60.9%, indicating a shift toward more severe financial situations. Chapter 13 filings represented 35.4% of the weekly total, marginally below 2024's 37.5% rate, suggesting fewer debtors are able to pursue repayment plans. Chapter 11 business reorganizations made up only 1.0% of filings, while Chapter 12 agricultural cases were virtually negligible at 0.04%. The week-to-week volatility demonstrates how bankruptcy filing patterns can fluctuate significantly even within stable economic conditions.
  3. An overview of this week's district-level filings with reference to actual district filing numbers. The Central District of California led the nation with 591 total bankruptcy filings in Week 43, comprising 506 Chapter 7 cases and 82 Chapter 13 cases. The Middle District of Florida followed closely with 554 filings (447 Chapter 7, 97 Chapter 13), while the Northern District of Illinois recorded 426 filings with a more balanced mix of 220 Chapter 7 and 204 Chapter 13 cases. The Eastern District of Michigan contributed 389 filings (226 Chapter 7, 163 Chapter 13), and the Northern District of Georgia registered 384 filings (232 Chapter 7, 147 Chapter 13). Other high-volume districts included the Southern District of Florida with 319 filings, Arizona with 296 filings, the Northern District of Ohio with 294 filings, New Jersey with 283 filings, and the Eastern District of New York with 279 filings.
  4. Geographic disparities in filings. The concentration of bankruptcy filings reveals dramatic geographic inequalities, with the Central District of California's 591 filings starkly contrasting against Guam's zero filings, creating an infinite disparity ratio. The median district recorded 94 filings during Week 43, demonstrating that half of all federal districts processed fewer than 100 bankruptcy cases. At the bottom of the distribution, Alaska recorded only 10 filings, Vermont had 5, and both the Northern Mariana Islands and Virgin Islands each registered just 1 filing. Year-over-year growth patterns show the Central District of California added 81 additional filings compared to Week 43 of 2024 (up 15.9%), while the Southern District of Texas experienced explosive 60.5% growth from 124 to 199 filings, and New Jersey expanded by 29.2% from 219 to 283 filings.
  5. Current year focus. Through the first 43 weeks of 2025, the nation has accumulated 465,920 total bankruptcy filings, positioning this year to potentially surpass 2024's full-year total of 503,737 filings. Chapter 7 liquidations have dominated 2025 with 289,970 cases year-to-date, while Chapter 13 reorganizations contributed 168,661 filings. Chapter 11 business bankruptcies totaled 7,036 cases through Week 43, and Chapter 12 agricultural bankruptcies remained minimal at 253 filings for the entire year to date. The weekly filing trajectory has accelerated throughout 2025, with the first five weeks averaging 9,315 filings compared to the most recent five weeks averaging 11,576 filings, representing substantial 24.3% growth from the year's beginning to its current stage.
  6. Comparative analysis with previous years. Week 43 comparisons across multiple years reveal a consistent upward trajectory in bankruptcy filings, with 2025's 11,550 filings representing a 13.8% increase over 2024's 10,146 filings for the same week. The year-over-year progression shows 2022's Week 43 recorded only 8,109 filings, which grew to 9,336 in 2023, then 10,146 in 2024, and finally reached 11,550 in 2025. Annual growth rates have moderated over time, with 2022 to 2023 showing 17.7% growth, 2023 to 2024 demonstrating 13.2% growth, and 2024 to 2025 (through Week 43) reflecting 11.2% growth. Full-year totals reveal an escalating crisis: 2022 closed with 378,317 filings, 2023 reached 445,166 filings, and 2024 hit 503,737 filings. Based on the current pace through 43 weeks, 2025 is projected to finish with approximately 563,438 total filings, representing 11.9% growth over 2024's already elevated levels.
  7. Analyzing the filings per capita. Week 43 of 2025 generated 3.40 bankruptcy filings per 100,000 population based on the current U.S. population of approximately 340 million residents. The 2025 annualized rate, calculated from the first 43 weeks, projects to 563,438 total filings, translating to 165.7 filings per 100,000 population for the full year. This per capita rate represents a substantial increase from historical levels, reflecting mounting financial pressures across American households. The current weekly rate suggests that roughly 1 in every 29,400 Americans filed for bankruptcy during Week 43 alone. These per capita figures help normalize the raw filing numbers and reveal that bankruptcy has become increasingly prevalent relative to population size.
  8. Analyzing the changing filings per capita. The per capita bankruptcy filing rate has escalated dramatically over the past four years, rising from 111.3 per 100,000 population in 2022 to a projected 165.7 in 2025. Between 2022 and 2023, the per capita rate jumped 17.6% to reach 130.9 per 100,000, signaling the beginning of accelerated financial distress. The rate continued climbing to 148.2 per 100,000 in 2024, representing a 13.2% year-over-year increase and a 33.2% cumulative increase since 2022. The projected 2025 rate of 165.7 per 100,000 represents an 11.8% increase over 2024 and a remarkable 48.9% cumulative increase since 2022. This consistent upward trend in per capita filings indicates that bankruptcy is not merely rising due to population growth but is genuinely becoming more prevalent across American society.
  9. Forecast the expected filing numbers for the rest of the year. With 9 weeks remaining in 2025 after Week 43, and based on the current weekly average of 10,835 filings, the nation can expect approximately 97,518 additional bankruptcy filings before year-end. This projection would bring the 2025 total to approximately 563,438 filings, representing an 11.9% increase over 2024's 503,737 total filings. The forecast suggests that 2025 will mark the highest bankruptcy filing year since the data collection began in 2022, continuing the uninterrupted upward trend. If weekly averages continue to accelerate as they have throughout 2025, the final total could potentially exceed 570,000 filings. The remaining weeks typically show seasonal patterns that could either moderate or amplify these projections depending on economic conditions and holiday-related financial pressures.
  10. Forecast the trends of increasing filings after 2024. Historical growth patterns suggest bankruptcy filings will continue their concerning upward trajectory well beyond 2024, with the average annual growth rate of 15.4% from 2022-2024 providing a baseline for future projections. Applying this historical growth rate to the projected 2025 total of 563,438 filings yields an estimated 650,160 filings in 2026, representing continued double-digit percentage growth. Extending this compound growth pattern suggests approximately 750,230 filings in 2027 and potentially 865,702 filings by 2028, though such projections assume economic conditions remain relatively stable. These forecasts indicate that annual bankruptcy filings could approach or exceed 900,000 cases by the decade's end if current acceleration trends persist unabated. However, actual future filing volumes will depend heavily on employment rates, inflation trajectories, interest rate policies, consumer debt levels, and potential economic shocks that could either exacerbate or moderate the current upward trend.

ChatGPT 5 Analysis of this Week's Bankruptcy Statistics

  1. The latest fully completed week is week 43 of 2025 (week starting 2025-10-20), with a national total of 11,550 filings. By chapter this week, totals are 7,335 for Chapter 7, 120 for Chapter 11, 5 for Chapter 12, and 4,090 for Chapter 13. Chapter shares of the national total are 63.51% (7), 1.04% (11), 0.04% (12), and 35.41% (13). Compared to the prior week’s 10,435 filings, this is an increase of 1,115 filings. That week-over-week change equals +10.69% based on weekly counts.
  2. An interesting detail is that Chapter 12 filings were only 5 this week. That’s the smallest chapter total among the four, versus 4,090 for Chapter 13 and 7,335 for Chapter 7. Week 43’s national total of 11,550 is also higher than week 43 in 2024 (10,146) by 1,404 filings. It is higher than week 43 in 2023 (9,336) by 2,214 filings. Those year-over-year deltas correspond to +13.84% versus 2024 and +23.71% versus 2023.
  3. District concentration remained evident this week. The top five districts by filings were CAC at 591, FLM at 554, ILN at 426, MIE at 389, and GAN at 384. Median district volume among reporting districts was 95 this week across 93 districts with non-zero activity. The smallest counts included NMI at 1, VI at 1, VT at 5, AK at 10, and DC at 12. Together, the five leading districts accounted for 2,344 filings out of 11,550 nationally.
  4. Geographic disparities were wide in the same week. The 90th-percentile district had 274 filings while the 10th-percentile district had 16 filings. That yields a 90/10 ratio of 17.12 using weekly district counts. Week-over-week, NYE rose by 121 filings and WAW rose by 76 filings. Conversely, KYE fell by 28 filings and PAM fell by 26 filings week to week.
  5. Focusing on the current year through week 43 shows strong momentum. Year-to-date through week 43 of 2025, the national total equals 465,920 filings across 43 weeks. Within that, Chapter 7 totals 289,970, Chapter 11 totals 7,036, Chapter 12 totals 253, and Chapter 13 totals 168,661. The average week in 2025 to date is 10,835 filings using the same weekly counts. This week’s 11,550 is 715 filings above that 2025 average.
  6. Comparisons with prior years at the same point underscore the trend. Year-to-date through week 43 in 2024 the national total was 418,877, and in 2023 it was 367,053. Using weekly averages through week 43, 2023 averaged 8,536 per week, 2024 averaged 9,741 per week, and 2025 is averaging 10,835 per week. That implies +14.12% growth from 2023 to 2024 in the weekly average and +11.23% growth from 2024 to 2025. At the single-week level for week 43, 2025’s 11,550 exceeds 2024’s 10,146 and 2023’s 9,336.
  7. A true per-capita picture requires population data, which this file does not include. As a numeric proxy drawn solely from weekly filings, we examine each district’s share of the national 11,550. This week, CAC represented 5.12% of national filings, FLM 4.80%, ILN 3.69%, MIE 3.37%, and GAN 3.32%. The median district’s share was 0.82% based on 95 filings out of 11,550. These share figures are computed directly from the district totals in this week’s data.
  8. Changes in the above “per-capita proxy” (district share of weekly national filings) provide more weekly insight. NYE’s share increased by 0.901 percentage points this week, while WAW’s share rose by 0.567 percentage points. AZ’s share increased by 0.330 percentage points and TNE’s share increased by 0.266 percentage points. On the downside, NJ’s share fell by 0.492 percentage points and NV’s share fell by 0.370 percentage points. The overall national week-over-week increase of 1,115 filings (+10.69%) frames these district share shifts.
  9. A simple projection for the rest of 2025 can be made from the 2025 average through week 43. Averaging 10,835 filings per week and assuming 9 remaining weeks yields about 97,518 additional filings for the year. Applying the same approach to chapters implies roughly 60,691 more for Chapter 7, 1,473 more for Chapter 11, 53 more for Chapter 12, and 35,301 more for Chapter 13. Adding those to year-to-date totals gives a full-year 2025 projection of about 563,438 filings nationally. The corresponding chapter projections sum to about 350,661 (7), 8,509 (11), 306 (12), and 203,962 (13) for the year.
  10. Extending the trend after 2024 using weekly averages suggests continued growth. Average weekly filings were 8,536 in 2023, 9,741 in 2024, and 10,835 in 2025 through week 43. A simple linear fit across years 2022 to 2025 points to an average week near 12,048 in 2026. That implies an approximate +11.19% increase from the 2025 average weekly level of 10,835. Relative to a full-year context, 2024 summed 503,737 while 2025 is projected near 563,438, a difference of 59,701 filings.

Gemini Advanced Analysis of the Bankruptcy Statistics

  • National Trends: Across the United States, bankruptcy filings are up across all chapters, indicating a widespread increase in financial distress. Chapter 7 filings show the most significant jump, suggesting more individuals are seeking a fresh start financially.
  • Business Bankruptcies: Chapter 11 filings, primarily used by businesses, are clustered in a few major districts, highlighting the role of specialized courts and legal expertise in handling complex reorganizations.
  • Regional Differences: Bankruptcy filings are not evenly distributed across the country. Some districts show much higher rates of Chapter 7 filings, pointing to potential disparities in economic conditions and financial pressures faced by households in those areas.
  • Urban vs. Rural: The data generally shows more bankruptcy filings in urban areas compared to rural ones, likely reflecting differences in population density, economic activity, and cost of living.
  • Year-to-Date: So far in 2025, we've seen a noticeable rise in bankruptcy filings compared to the same period last year. This increase is driven by a surge in Chapter 7, Chapter 13, and Chapter 11 cases.
  • Pre-Pandemic Comparison: While filings are up, they are still lower than the levels seen before the pandemic. This suggests that the economic recovery is still ongoing, but financial challenges persist for many.
  • Population Matters: When we factor in population size, some districts with lower overall filings actually have higher bankruptcy rates per person. This highlights the importance of considering population density when assessing financial vulnerability.
  • Accelerating Trends: The rate at which bankruptcy filings are increasing is not uniform. Some regions, particularly in the Southwest and Southeast, are experiencing a faster acceleration in filings, indicating growing financial pressure in those areas.
  • Future Outlook: The trends suggest that bankruptcy filings will continue to rise throughout the rest of 2025, particularly for Chapter 7. This points to a potential ongoing wave of individuals seeking debt relief.
  • Long-Term Projections: Bankruptcy filings are likely to remain elevated in the years to come, especially with factors like increasing student loan debt and high-interest rates. This indicates a long-term challenge for individuals and businesses alike.

Subscribe to the Data-Driven BankruptcyWatch Report

Loading...
newsletter