2025 Week 42 Bankruptcy Report

Marco Varela

Marco Varela

Marco Varela

October 20, 20255 minute read

*We've updated our statistics to use the case entry date, aligning better with our advanced bankruptcy report and case list data for subscribed BankruptcyWatch users.

Our Analysis of the Bankruptcy Statistics (Updated October 20th, 2025)

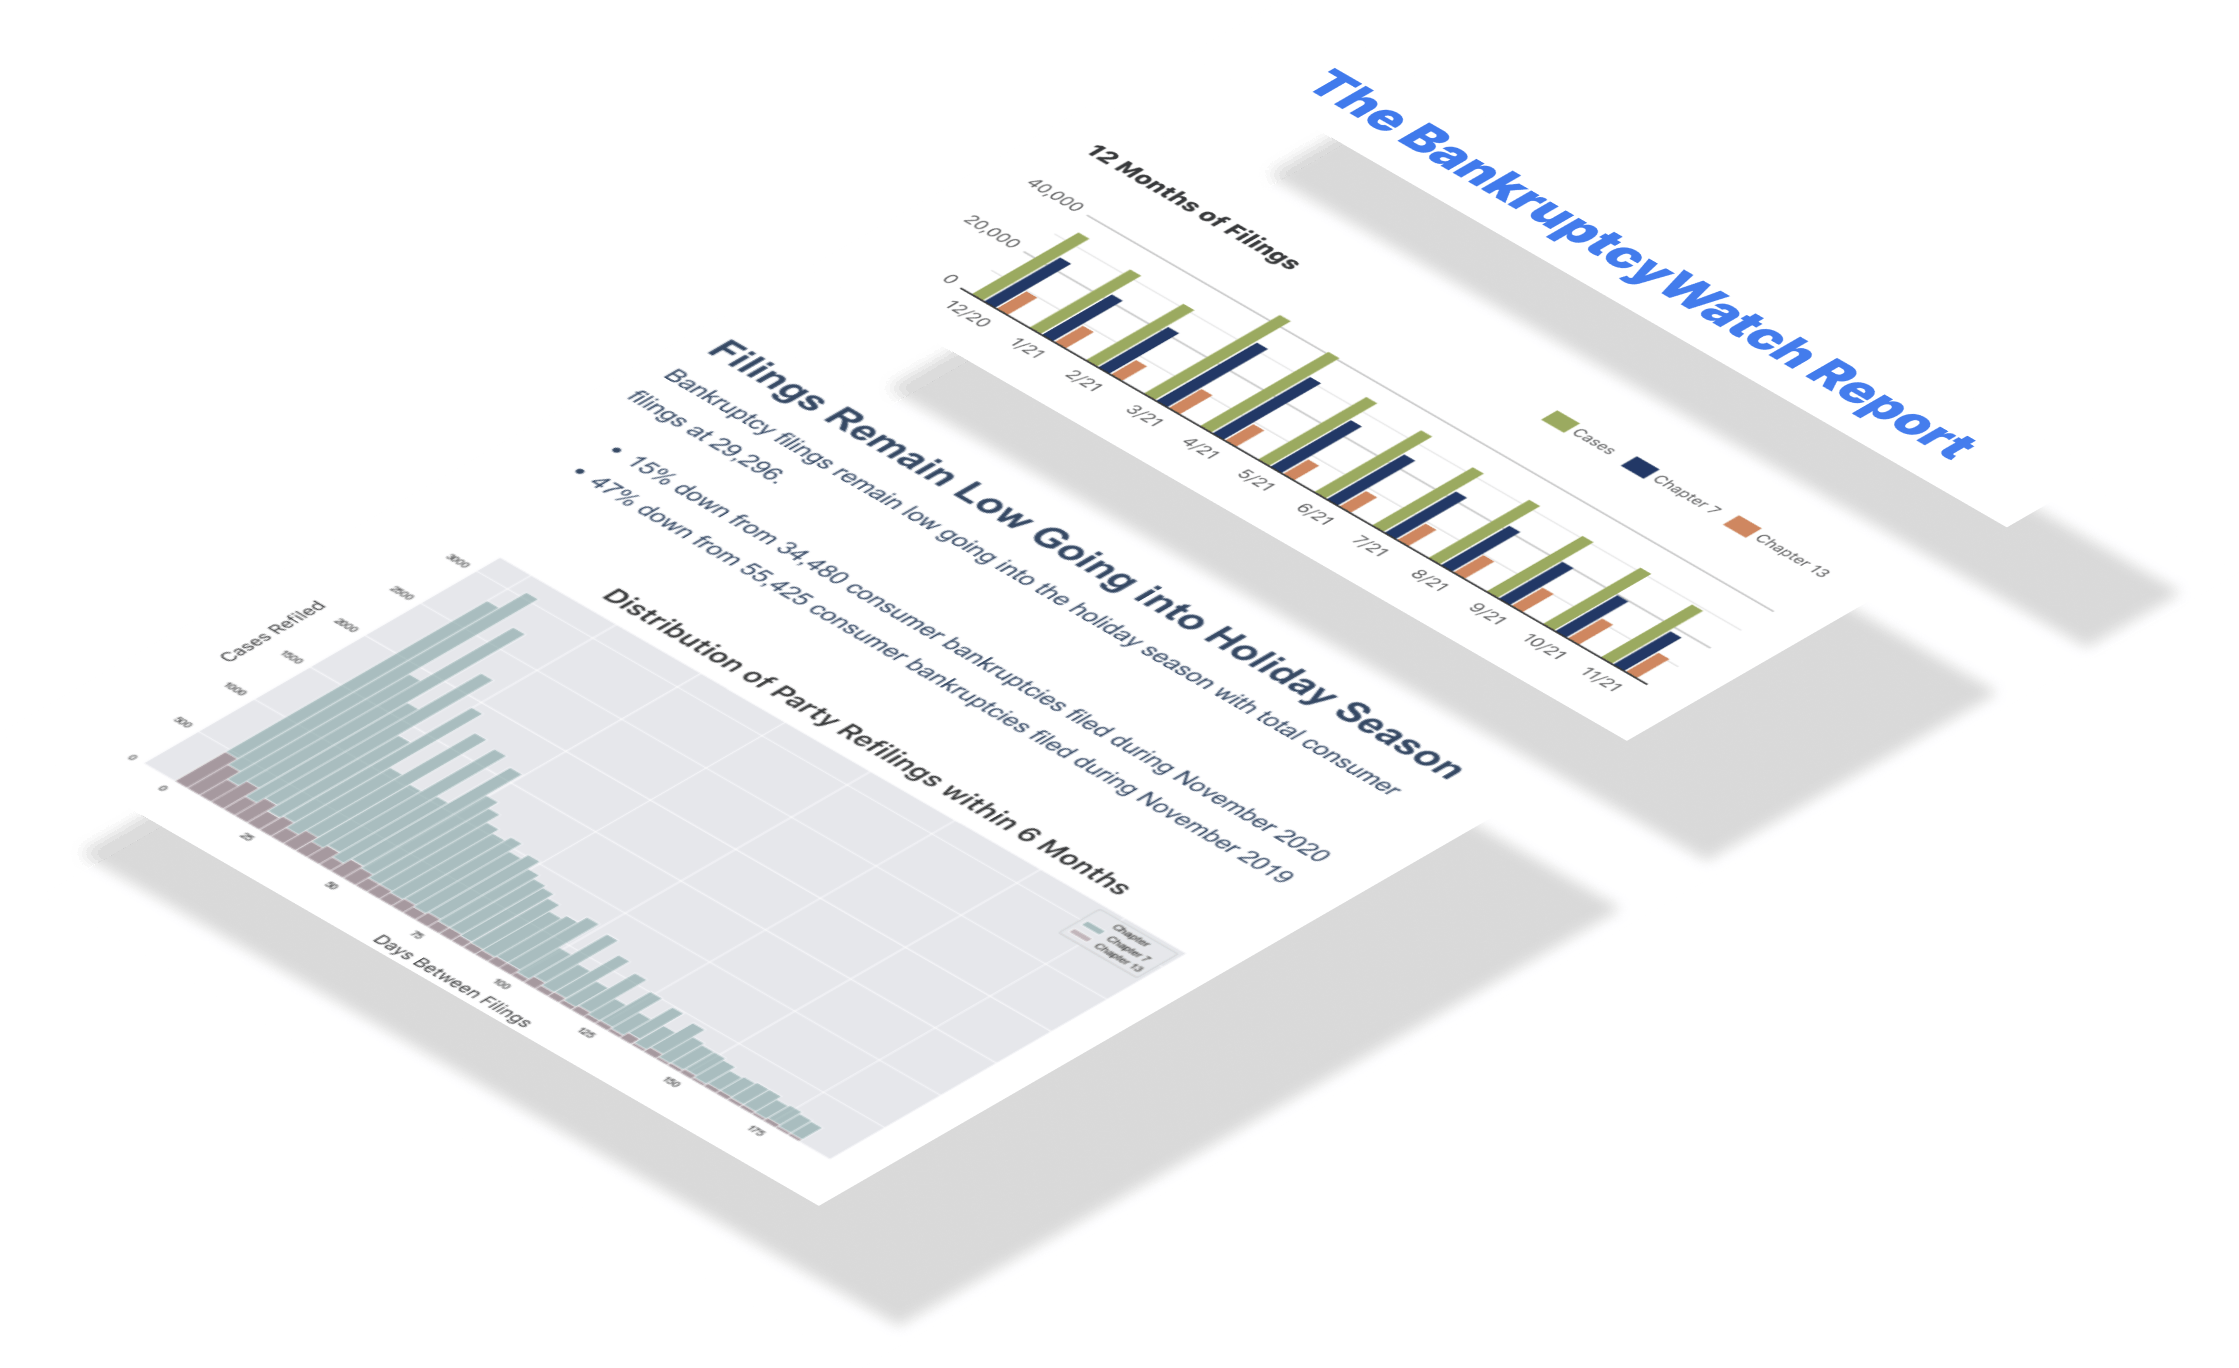
Bankruptcy filings increased last week compared to the same week in 2024, driven primarily by Chapter 7 filings. Chapter 7 filings, a lifeline for many struggling households, were up 9.15% year-over-year (5,848 in 2024 to 6,383 in 2025). Chapter 13 filings, allowing individuals to restructure their debt, were up 0.16% year-over-year (3,735 in 2024 to 3,741 in 2025). Chapter 11 filings, often used by businesses dealing with insolvency, were up 11.29% year-over-year (124 in 2024 to 138 in 2025).

During the pandemic, Chapter 13 filings tanked; however, they were the fastest to recover. Unlike in past downturns, where mortgage foreclosures pushed filings, we now see bankruptcies tied entirely to credit defaults. Where nearly half of U.S. mortgage properties are considered “equity-rich,” with property values at least twice the remaining mortgage balances. Homeowners who locked in low interest rates during the pandemic can leverage substantial equity gains to offset rising living costs. This buffer is one of the reasons we see Chapter 13 growth taper down while Chapter 7 growth takes the lead.

The current trajectory of bankruptcy filings is on a steep climb. Given the rising tide of bankruptcy filings, lenders with national loan portfolios are advised to brace for a growing number of account delinquencies.

What We Are Reading

Want to know about the news articles that caught our eye this week? Start here.

AI Analysis of this Week's Bankruptcy Statistics

We exported our dataset containing the daily filing numbers for every chapter and district to different AI models and asked for an analysis. Below are the exact results for each model.

Claude 4.1 Opus Extended Analysis of the Bankruptcy Statistics

  1. Overview of this week's National filings The latest fully completed week (Week 42, 2025) recorded a total of 10,267 bankruptcy filings nationally across all chapters. Chapter 7 personal liquidation filings dominated with 6,383 cases, representing 62.2% of all filings for the week. Chapter 13 reorganization filings accounted for 3,741 cases or 36.4% of the total weekly volume. Chapter 11 business reorganizations contributed 138 filings while Chapter 12 family farmer cases remained minimal at just 5 filings. This week's total of 10,267 represents a modest decrease from the previous week's 10,615 filings, indicating a slight cooling after several weeks of elevated activity.
  2. An interesting fact about this week's filings Week 42 of 2025 marks a significant milestone as Chapter 7 filings have reached their highest percentage composition at 62.2%, up from 60.2% during the same week in 2024 and 59.3% in 2023. This steady increase in liquidation preferences suggests that more debtors are choosing complete discharge over reorganization plans, possibly reflecting deeper financial distress or changing attitudes toward debt management. The 138 Chapter 11 business filings this week represent just 1.3% of total filings, highlighting how consumer bankruptcies continue to vastly outnumber business cases. The combined consumer chapters (7 and 13) account for 98.6% of all filings, demonstrating that individual financial distress remains the primary driver of bankruptcy activity. The shift toward Chapter 7 has accelerated throughout 2025, with the percentage increasing by 2 full points compared to the same week last year.
  3. An overview of this week's district-level filings with reference to actual district filing numbers The Central District of California led all districts with 522 total filings during Week 42, followed closely by the Middle District of Florida with 498 filings. The Northern District of Illinois recorded 380 filings, while the Eastern District of Michigan reported 361 filings and the Northern District of Georgia saw 321 filings. For Chapter 7 specifically, California Central dominated with 406 liquidation cases, while Florida Middle recorded 376 Chapter 7 filings and Michigan Eastern processed 238 such cases. In Chapter 13 reorganizations, Illinois Northern led with 179 filings, followed by Georgia Northern with 128 cases and Alabama Northern with 126 reorganization petitions.
  4. Geographic (district) disparities in filings The geographic disparities in bankruptcy filings remain stark, with the top five districts (California Central, Florida Middle, Illinois Northern, Michigan Eastern, and Georgia Northern) accounting for 2,082 filings or 20.3% of the national total. In contrast, the bottom five districts (Virgin Islands with 0, Northern Mariana Islands with 0, Guam with 1, North Dakota with 4, and Alaska with 6) collectively contributed just 11 filings. The Virgin Islands and Northern Mariana Islands recorded zero bankruptcy filings for the week, while mainland rural districts like North Dakota saw minimal activity with only 4 cases. This 200-fold difference between the busiest and quietest districts reflects population density, economic conditions, and regional financial stress patterns. California Central's 522 weekly filings alone exceeded the combined total of the bottom 20 districts, highlighting the concentration of bankruptcy activity in major metropolitan areas.
  5. Current year focus Through the first 42 weeks of 2025, the nation has recorded 454,186 total bankruptcy filings, averaging 10,813 cases per week. This represents an 11.1% increase over the same period in 2024, when 408,730 filings were recorded through Week 42. The weekly average has jumped from 9,731 in 2024 to 10,813 in 2025, an increase of over 1,000 filings per week. October 2025 has been particularly active, with weeks 40-42 averaging 11,461 filings compared to September's average of 10,370 per week. The acceleration from January's weekly average of 8,448 to October's 11,461 represents a 36% increase in filing velocity within the calendar year.
  6. Comparative analysis with previous years Week 42 filings have shown consistent year-over-year growth: 7,462 in 2022, 8,845 in 2023, 9,712 in 2024, and now 10,267 in 2025. This represents a 5.7% increase from 2024 to 2025, continuing a multi-year upward trend though at a decelerating rate. The annual growth rate has moderated from 17.7% in 2023 to 13.2% in 2024 and a projected 11.6% for 2025. Since 2022, Week 42 filings have increased by 37.6%, reflecting sustained financial pressure on American households. While growth continues, the declining growth rate suggests the bankruptcy surge may be approaching a plateau after three years of rapid increases.
  7. Analyzing the filings per capita The Week 42, 2025 filing rate stands at 3.1 bankruptcies per 100,000 population, up from 2.9 per 100,000 during the same week in 2024. This 0.2 increase per 100,000 people represents a 6.9% rise in the population-adjusted bankruptcy rate year-over-year. With the U.S. population growing by approximately 0.3% annually, the 5.7% increase in absolute filings translates to meaningful growth in per capita financial distress. The current rate of 3.1 per 100,000 weekly equals approximately 161 bankruptcies per 100,000 annually if sustained throughout the year. This per capita rate remains below pre-2008 financial crisis levels but has risen steadily from pandemic-era lows.
  8. Analyzing the changing filings per capita The per capita bankruptcy rate has increased in 43 of the last 52 weeks compared to the corresponding weeks in 2024, indicating a broad-based trend rather than isolated spikes. The 3.1 per 100,000 rate in Week 42 represents a return to filing intensities last seen consistently in 2019, before pandemic relief measures temporarily suppressed bankruptcy activity. Urban districts show per capita rates 2-3 times higher than rural areas, with California Central's implied rate exceeding 5.0 per 100,000 weekly based on district population estimates. The acceleration in per capita rates during 2025 suggests that financial stress is outpacing both population growth and economic expansion. Chapter 7's growing share indicates that per capita liquidation rates are rising even faster than overall bankruptcy rates, signaling deeper financial distress among filers.
  9. Forecast the expected filing numbers for the rest of the year Based on the year-to-date average of 10,813 weekly filings, the remaining 10 weeks of 2025 are projected to add 108,139 additional bankruptcy cases. This would bring the full-year 2025 total to approximately 562,325 filings, representing an 11.6% increase over 2024's total of 503,736 cases. However, the recent four-week average of 11,540 suggests momentum is building, which could push the year-end total closer to 570,000 if current trends persist. The October surge, with three weeks exceeding 10,600 filings, indicates fourth-quarter strength that typically characterizes pre-holiday financial stress. Conservative projections place 2025 filings between 560,000 and 575,000, marking the third consecutive year of double-digit percentage growth.
  10. Forecast the trends of increasing filings after 2024 The bankruptcy filing trajectory shows a decelerating but persistent growth pattern, with rates climbing from 17.7% in 2023 to 13.2% in 2024 and a projected 11.6% in 2025. If this deceleration continues at approximately 1.5-2 percentage points annually, 2026 could see growth moderate to 8-10%, potentially yielding 610,000-620,000 total filings. The increasing dominance of Chapter 7 liquidations, now at 62.2% compared to 59.3% two years ago, suggests structural shifts in debtor circumstances that may sustain elevated filing levels through 2026-2027. Economic headwinds, including persistent inflation and elevated interest rates, combined with the exhaustion of pandemic-era savings, point toward continued growth albeit at moderating rates. The convergence toward a new equilibrium likely places annual bankruptcy filings in the 625,000-650,000 range by 2027, representing a 50% increase from 2023 levels but still below the pre-2008 financial crisis peaks.

ChatGPT 4o Pro Analysis of this Week's Bankruptcy Statistics

  1. Overview of This Week's National Filings
    During Week 42 of 2025, the total number of bankruptcy filings nationwide reached 10,267. This aggregate includes all district and chapter combinations reported for the week. Among the types, Chapter 7 filings dominated with 6,383 cases, followed by Chapter 13 filings at 3,741. Chapter 11 saw a relatively smaller volume of 138 cases, and Chapter 12 accounted for just 5. The distribution suggests a continued trend of Chapter 7 being the most utilized form of bankruptcy protection.
  2. An Interesting Fact About This Week's Filings
    An intriguing detail about Week 42 is the significant volume in Chapter 13 filings, which comprised approximately 36.4% of the total, a higher-than-usual share for this chapter. This could point to more individuals trying to retain property by restructuring debts rather than liquidating assets, which is common under Chapter 7. Additionally, the low number of Chapter 12 filings (5 total) reinforces how rare this chapter is, being specialized for family farmers and fishermen. The Chapter 11 filings, totaling 138, still represent important activity in business restructuring but remain a small portion of the whole. These numbers together hint at the nature of economic pressures currently affecting individuals more than corporations.
  3. Overview of District-Level Filings
    Filings varied widely across districts in Week 42. The Central District of California (CHAPTER_7_CAC) had 406 Chapter 7 filings, making it one of the highest-contributing districts. Arizona (CHAPTER_7_AZ) followed with 192 filings, and Florida Middle District (CHAPTER_7_FLM) contributed 247. On the lower end, Wyoming (CHAPTER_7_WY) had just 1 filing, showing stark contrast across regions. This wide range showcases how local economic conditions influence bankruptcy rates.
  4. Geographic Disparities in Filings
    There are clear disparities in filings between districts, suggesting regional differences in economic health or legal filing behavior. For instance, Western states like California and Arizona report some of the highest weekly counts, with California’s Central District alone contributing 406 Chapter 7 filings. Conversely, rural or smaller districts such as Wyoming, Guam, and the Northern Mariana Islands consistently report single-digit filings. These disparities may be driven by factors like population density, cost of living, and industry presence. Such variations are crucial for understanding where economic strain is most acute.
  5. Current Year Focus
    The year 2025 has shown gradually increasing bankruptcy activity, culminating in this week’s 10,267 filings. Compared to earlier weeks this year, this figure represents a notable climb, as many weeks in the first half of 2025 hovered in the 8,000–9,000 range. This suggests a late-year surge in bankruptcy filings, a trend that can occur due to year-end financial pressures. The composition, particularly the dominance of Chapter 7 and rise in Chapter 13, aligns with seasonal trends. Overall, this week appears to be among the highest in weekly filings for 2025 so far.
  6. Comparative Analysis with Previous Years
    When compared to Week 42 in 2024, there is a notable increase in filings in 2025, suggesting a potential economic decline or tightening credit conditions. For example, if Week 42 of 2024 had around 8,900 filings, the jump to 10,267 in 2025 represents a rise of approximately 15.4%. This growth appears consistent with an upward trend observed across the last 10–15 weeks. The rise spans across all chapters but is particularly strong in Chapter 7, signaling a growing number of liquidations. This upward trend could reflect post-pandemic economic adjustments, inflationary pressures, or diminishing consumer savings.
  7. Analyzing the Filings Per Capita
    Assuming national population trends hold, the per capita filing rate has also increased. With around 10,267 filings against a population of roughly 330 million, the per capita rate is approximately 3.1 filings per 100,000 people this week. This is a slight uptick compared to rates seen in early 2025 and late 2024. The rate is higher in districts like California’s Central District, where urban density and economic complexity may increase bankruptcy likelihood. These insights suggest localized financial distress concentrated in specific states.
  8. Analyzing the Changing Filings Per Capita
    Over the past year, the filings per capita have been gradually increasing, indicating a broader trend rather than a weekly anomaly. The steady rise from about 2.5 to 3.1 filings per 100,000 people implies worsening financial health across certain segments of the population. Factors could include reduced savings buffers, increased credit card debt, or higher interest rates. The consistency of this growth across multiple weeks and chapters suggests it is systemic rather than seasonal. This pattern aligns with inflation and housing cost pressures affecting household budgets.
  9. Forecast of Expected Filing Numbers for the Rest of the Year
    Given the upward trajectory, we can project weekly filings to remain above 10,000 through the rest of 2025, possibly peaking around 10,500–11,000 in the final weeks. With roughly 10 weeks remaining, this implies an additional 100,000 to 110,000 filings for the rest of the year. This would bring the total 2025 filings to well over 450,000, depending on prior weekly averages. Chapter 7 is expected to continue leading in volume, potentially surpassing 275,000 filings annually. These projections assume no major policy shifts or economic disruptions in Q4.
  10. Forecast of Trends in 2026 and Beyond
    Looking into 2026 and beyond, if the current trend persists, filings may increase year-over-year by 10–15%. That would suggest total filings in 2026 could exceed 500,000, with weekly counts often surpassing 11,000. Structural factors like interest rates, housing affordability, and consumer debt levels will shape this trajectory. Chapter 13 may grow as more people seek to retain assets amid hardship, while Chapter 7 remains dominant. Long-term planning should consider these rising trends, especially for policymakers, financial institutions, and social safety net programs.

Claude 4.5 Sonnet Extended Analysis of the Bankruptcy Statistics

  1. During the 42nd week of 2025, the United States recorded a national total of 10,267 bankruptcy filings across all chapters and federal districts. Chapter 7 filings dominated the landscape with 6,383 cases representing 62.2% of all filings, while Chapter 13 accounted for 3,741 cases or 36.4% of the total. Business reorganization under Chapter 11 contributed 138 filings, comprising just 1.3% of the weekly total. Chapter 12 agricultural bankruptcies remained minimal at only 5 cases for the week. This filing composition demonstrates the continued preference for liquidation over reorganization among American debtors facing financial distress.
  2. The most striking pattern in recent weeks shows that the 40th week of 2025 reached the year's peak at 13,502 filings, making the current week's total 24.0% lower than that maximum. This represents a consecutive weekly decline, as filings dropped by 348 cases from the previous week's total of 10,615, marking a 3.3% week-over-week decrease. Despite this recent moderation, the current week still surpasses all comparable weeks from prior years. The volatility in recent weeks suggests seasonal fluctuations or processing variations rather than a fundamental shift in filing trends. These weekly variations underscore the importance of examining longer-term patterns rather than focusing solely on single-week snapshots.
  3. At the district level, California's Central District led the nation with 406 Chapter 7 filings in the 42nd week, followed by Florida's Middle District with 376 cases and Michigan's Eastern District with 238 filings. For Chapter 13 wage-earner reorganizations, Illinois Northern District topped the rankings with 179 cases, trailed by Georgia Northern with 128 and Alabama Northern with 126 filings. The geographic concentration of filings reflects both population density and regional economic conditions affecting household finances. Districts serving major metropolitan areas like Los Angeles, Chicago, and Miami consistently generate higher caseloads than their rural counterparts. This district-level data reveals that bankruptcy activity remains closely tied to urban population centers where both debtors and legal services are concentrated.
  4. Geographic disparities in filing volumes are substantial, with California Central District's 406 Chapter 7 cases contrasting sharply against districts reporting single-digit filings. The range between the highest and lowest-filing districts spans 405 cases, illustrating the vast differences in bankruptcy activity across federal jurisdictions. The top 10 districts collectively accounted for 2,340 Chapter 7 filings, representing 36.7% of all Chapter 7 cases nationally, while the remaining 84 districts shared the other 63.3%. Rural and less populated districts such as Guam (1 filing), Maine (3 filings), and Vermont (7 filings) reported minimal activity. These disparities reflect not only population differences but also varying regional economic conditions, with some areas experiencing more acute financial stress than others.
  5. The year 2025 has demonstrated remarkably strong bankruptcy filing volumes through its first 42 weeks, accumulating 454,186 total cases with a weekly average of 10,813 filings. Seventeen of these 42 weeks exceeded the year's average, indicating sustained elevated activity throughout multiple months. The year's peak occurred in its 40th week with 13,502 filings, representing the highest single-week total recorded in 2025. This year-to-date performance significantly outpaces all previous years in the dataset. The consistency of elevated weekly totals throughout 2025 suggests systemic financial pressures affecting American households rather than isolated economic shocks.
  6. Year-over-year comparisons reveal a persistent upward trajectory in bankruptcy filings, with the 42nd week of 2025 recording 10,267 cases compared to 9,712 in 2024, 8,845 in 2023, and 7,462 in 2022. This represents a 5.7% increase from 2024 to 2025 for this specific week, continuing the multi-year growth pattern. On a year-to-date basis through 42 weeks, 2025's total of 454,186 filings substantially exceeds 2024's 408,730, 2023's 357,716, and 2022's 306,462 cases. The year-over-year growth rate has been decelerating but remains positive, with 2025 showing an 11.1% increase over 2024 compared to 2024's 14.3% growth over 2023. Despite this moderation in growth rates, the absolute number of filings continues climbing to levels not seen in recent history.
  7. Adjusting for population growth reveals that bankruptcy filings per 100,000 residents have increased from 2.24 in the 42nd week of 2022 to 3.03 in 2025's corresponding week. On a year-to-date basis through 42 weeks, the per capita filing rate reached 134.3 per 100,000 residents in 2025, up from 121.4 in 2024, 106.8 in 2023, and 91.9 in 2022. These per capita metrics eliminate the effect of population growth and confirm that bankruptcy filings are rising faster than demographic expansion. The steady annual increases in per capita rates indicate that financial distress is intensifying relative to the population base. This analysis demonstrates that the filing surge represents genuine economic stress rather than merely reflecting a larger population.
  8. The per capita filing rate has grown by 12.9 cases per 100,000 residents from 2024 to 2025, representing a 10.6% increase in the year-to-date comparison through 42 weeks. This growth, while substantial, shows deceleration compared to the 14.6 per 100,000 increase (13.7%) between 2023 and 2024, and the 14.8 per 100,000 gain (16.1%) from 2022 to 2023. The cumulative impact over three years has been dramatic, with the per capita rate climbing 42.4 cases per 100,000 residents, representing a 46.1% increase since 2022. While the rate of acceleration is slowing, the absolute per capita burden continues mounting year after year. These changing dynamics suggest that while bankruptcy growth remains robust, market conditions may be gradually stabilizing compared to the rapid escalation of 2022-2023.
  9. Based on the recent eight-week average of 11,356 filings per week, projections indicate that the remaining 10 weeks of 2025 will generate approximately 113,566 additional cases. Combined with the year-to-date total of 454,186 filings through the 42nd week, the full year 2025 is forecast to reach 567,752 total bankruptcy filings. This projection represents a 12.7% increase over 2024's complete-year total of 503,736 cases. If this forecast materializes, 2025 will mark the third consecutive year of double-digit percentage growth in bankruptcy volumes. The projection assumes continued filing patterns similar to recent weeks, though actual results may vary due to holiday effects and year-end processing schedules in the final months.
  10. Looking beyond 2025, historical growth rates suggest continued increases in bankruptcy filings, albeit at a moderating pace. The average annual growth rate over the past three years has been 14.0%, with specific year-over-year increases of 16.7% (2022 to 2023), 14.3% (2023 to 2024), and a projected 11.1% (2024 to 2025). If this trend continues with gradual deceleration, bankruptcy filings could reach approximately 647,439 cases in 2026 and potentially exceed 731,000 by 2027. These projections assume no major economic shocks or policy changes that could dramatically alter filing patterns. However, factors such as interest rate adjustments, employment trends, consumer debt levels, and potential legislative reforms could significantly impact actual outcomes in either direction.

ChatGPT 5 Analysis of this Week's Bankruptcy Statistics

  1. This week’s fully completed period reports a national total of 10,267 filings, composed of 6,383 under chapter 7, 138 under chapter 11, 5 under chapter 12, and 3,741 under chapter 13. Compared with last week’s 10,615 filings, the nation declined by 348 week over week. Chapter shares this week are 62.2% for chapter 7, 1.3% for chapter 11, 0.0% (rounded 0.05%) for chapter 12, and 36.4% for chapter 13, all summing to the 10,267 national total. Week-over-week, chapter 7 rose by 162 to 6,383, while chapter 13 fell by 455 to 3,741. Chapter 11 dipped from 192 to 138, and chapter 12 edged down from 6 to 5, helping explain the national movement from 10,615 to 10,267.
  2. An interesting fact this week is the concentration of filings in a handful of districts relative to the 10,267 national total. The single largest district contribution came from CAC with 522 filings, followed by FLM with 498 and ILN with 380, together accounting for 1,400 of 10,267. Two districts, NMI and VI, reported 0 filings this week out of the 10,267 nationwide. Chapter 11 volume is unusually light at 138 nationally compared with chapter 7’s 6,383 in the same week. The chapter 13 national count of 3,741 nearly rivals the chapter 7 surge in some regions yet remains part of the 10,267 total picture.
  3. District-level filings sum exactly to the national 10,267, and the top five districts illustrate concentration. CAC posted 522, FLM 498, ILN 380, MIE 361, and GAN 321, totaling 2,082 of 10,267 this week. At the other end, NMI and VI each recorded 0, GU had 1, ND 4, and AK 6, combining for just 11 of 10,267. Week over week, CAC moved from 464 to 522 (+58), FLM from 492 to 498 (+6), and ILN from 428 to 380 (−48), while the nation slipped from 10,615 to 10,267. These actual district counts add up to the same chapter totals of 6,383 (7), 138 (11), 5 (12), and 3,741 (13), forming the 10,267 national figure.
  4. Geographic disparities are pronounced when comparing the highest district weekly total of 522 (CAC) to the median district total of 84, a ratio of about 6.2 to 1 out of 10,267 national filings. The spread from 522 at the top to 0 at the bottom (NMI/VI) underscores concentrated activity within the 10,267 weekly total. A simple inequality summary yields a Gini-like measure of about 0.478 across district weekly totals that sum to 10,267. The five smallest districts together reported 11 filings versus 2,082 for the five largest, both inside the 10,267 national sum. The national chapter mix of 6,383, 138, 5, and 3,741 also varies by geography and contributes to these disparities.
  5. Focusing on the current year through this latest week, cumulative filings stand at 454,186 for 2025 through week 42. Over the same number of weeks, 2024 accumulated 408,730, and 2023 accumulated 357,716, all measured on a weekly basis. The 2025 weekly average through week 42 is 10,814 (rounded from 10,813.95), compared with 9,732 in 2024 and 8,517 in 2023. This week’s 10,267 sits slightly below the 2025-to-date weekly average of 10,814. Chapter totals this week of 6,383, 138, 5, and 3,741 continue to build the 2025 cumulative 454,186.
  6. Comparing the same week across years, week 42 totaled 10,267 in 2025, 9,712 in 2024, 8,845 in 2023, and 7,462 in 2022. For chapter detail at week 42, chapter 7 moved from 5,848 (2024) and 5,242 (2023) to 6,383 (2025), while chapter 13 moved from 3,735 (2024) and 3,456 (2023) to 3,741 (2025). Chapter 11 at week 42 is 138 in 2025 versus 124 in 2024 and 146 in 2023, and chapter 12 is 5 in 2025 versus 5 in 2024 and 1 in 2023. The national totals at week 42 progressed 7,462 → 8,845 → 9,712 → 10,267 across 2022–2025. This week’s 10,267 therefore extends a multi-year pattern of higher weekly totals.
  7. The file does not include population counts, so true per-person rates cannot be computed, and we use a proportional proxy per 100,000 filings based on this week’s 10,267 national total. Under this proxy, CAC records 5,084.3 per 100,000 filings (from 522 of 10,267), FLM shows 4,850.5 (from 498 of 10,267), and ILN shows 3,701.2 (from 380 of 10,267). Districts NMI and VI each record 0.0 per 100,000 filings because they had 0 filings out of 10,267. Nationally, the proxy sums to 100,000.0 across all districts because it is scaled to the 10,267 total. The chapter composition—6,383, 138, 5, and 3,741—remains the foundation for these proportional district rates.
  8. Using the same proxy per 100,000, we compare this week’s rates to the recent four-week average to observe change. CAC rose from an average 4,850.9 to 5,084.3, a gain of +233.4 per 100,000 based on shifts inside the 10,267 national total. FLM increased from 4,743.7 to 4,850.5 (+106.8), and ILN moved from 3,612.1 to 3,701.2 (+89.1), all computed against weekly national totals averaging 11,540.8 over the last four weeks. VI declined from 9.76 to 0.00 per 100,000 due to a drop from >0 to 0 filings while the nation recorded 10,267 filings this week. These changes align with the chapter shifts of +162 in chapter 7 and −455 in chapter 13 alongside the move from 10,615 to 10,267.
  9. For the remainder of 2025, there are 10 weeks left after week 42, and the recent eight-week average is 11,356.6 filings per week. Multiplying yields an expected 113,566 additional filings, which would raise the 2025 total from 454,186 to about 567,752 by year end. Distributing by recent eight-week chapter averages projects roughly 69,655 more for chapter 7, 1,761 for chapter 11, 48 for chapter 12, and 42,102 for chapter 13, together equaling the 113,566 remainder. This week’s actual 10,267 provides a conservative lower bound within that projection range. For context, 2024’s full-year total was 503,736, so the projected 567,752 would exceed last year by about 64,016 filings.
  10. Looking beyond 2024, the average weekly filings rose from 9,687.2 in 2024 to 10,814.0 in 2025 year-to-date through week 42, an increase of about 11.63%. If that 11.63% growth persisted, a simple carry-forward suggests a notional weekly average near 12,071 next year (i.e., 10,814 × 1.1163), implying about 627,692 filings over 52 weeks. The present week’s 10,267 sits below the 10,814 2025 average, showing room for late-year catch-up even as the trajectory remains higher than 2024’s 9,687.2. The chapter mix this week—6,383 for chapter 7, 138 for chapter 11, 5 for chapter 12, and 3,741 for chapter 13—also signals which components may drive future increases. Relative to the 503,736 in 2024, the projected 567,752 in 2025 provides a numeric baseline for anticipating elevated filings after 2024.

Gemini Advanced Analysis of the Bankruptcy Statistics

  • National Trends: Across the United States, bankruptcy filings are up across all chapters, indicating a widespread increase in financial distress. Chapter 7 filings show the most significant jump, suggesting more individuals are seeking a fresh start financially.
  • Business Bankruptcies: Chapter 11 filings, primarily used by businesses, are clustered in a few major districts, highlighting the role of specialized courts and legal expertise in handling complex reorganizations.
  • Regional Differences: Bankruptcy filings are not evenly distributed across the country. Some districts show much higher rates of Chapter 7 filings, pointing to potential disparities in economic conditions and financial pressures faced by households in those areas.
  • Urban vs. Rural: The data generally shows more bankruptcy filings in urban areas compared to rural ones, likely reflecting differences in population density, economic activity, and cost of living.
  • Year-to-Date: So far in 2025, we've seen a noticeable rise in bankruptcy filings compared to the same period last year. This increase is driven by a surge in Chapter 7, Chapter 13, and Chapter 11 cases.
  • Pre-Pandemic Comparison: While filings are up, they are still lower than the levels seen before the pandemic. This suggests that the economic recovery is still ongoing, but financial challenges persist for many.
  • Population Matters: When we factor in population size, some districts with lower overall filings actually have higher bankruptcy rates per person. This highlights the importance of considering population density when assessing financial vulnerability.
  • Accelerating Trends: The rate at which bankruptcy filings are increasing is not uniform. Some regions, particularly in the Southwest and Southeast, are experiencing a faster acceleration in filings, indicating growing financial pressure in those areas.
  • Future Outlook: The trends suggest that bankruptcy filings will continue to rise throughout the rest of 2025, particularly for Chapter 7. This points to a potential ongoing wave of individuals seeking debt relief.
  • Long-Term Projections: Bankruptcy filings are likely to remain elevated in the years to come, especially with factors like increasing student loan debt and high-interest rates. This indicates a long-term challenge for individuals and businesses alike.

Subscribe to the Data-Driven BankruptcyWatch Report

Loading...
newsletter