2025 Week 39 Bankruptcy Report

Marco Varela

Marco Varela

Marco Varela

September 29, 20255 minute read

*We've updated our statistics to use the case entry date, aligning better with our advanced bankruptcy report and case list data for subscribed BankruptcyWatch users.

Our Analysis of the Bankruptcy Statistics (Updated September 29th, 2025)

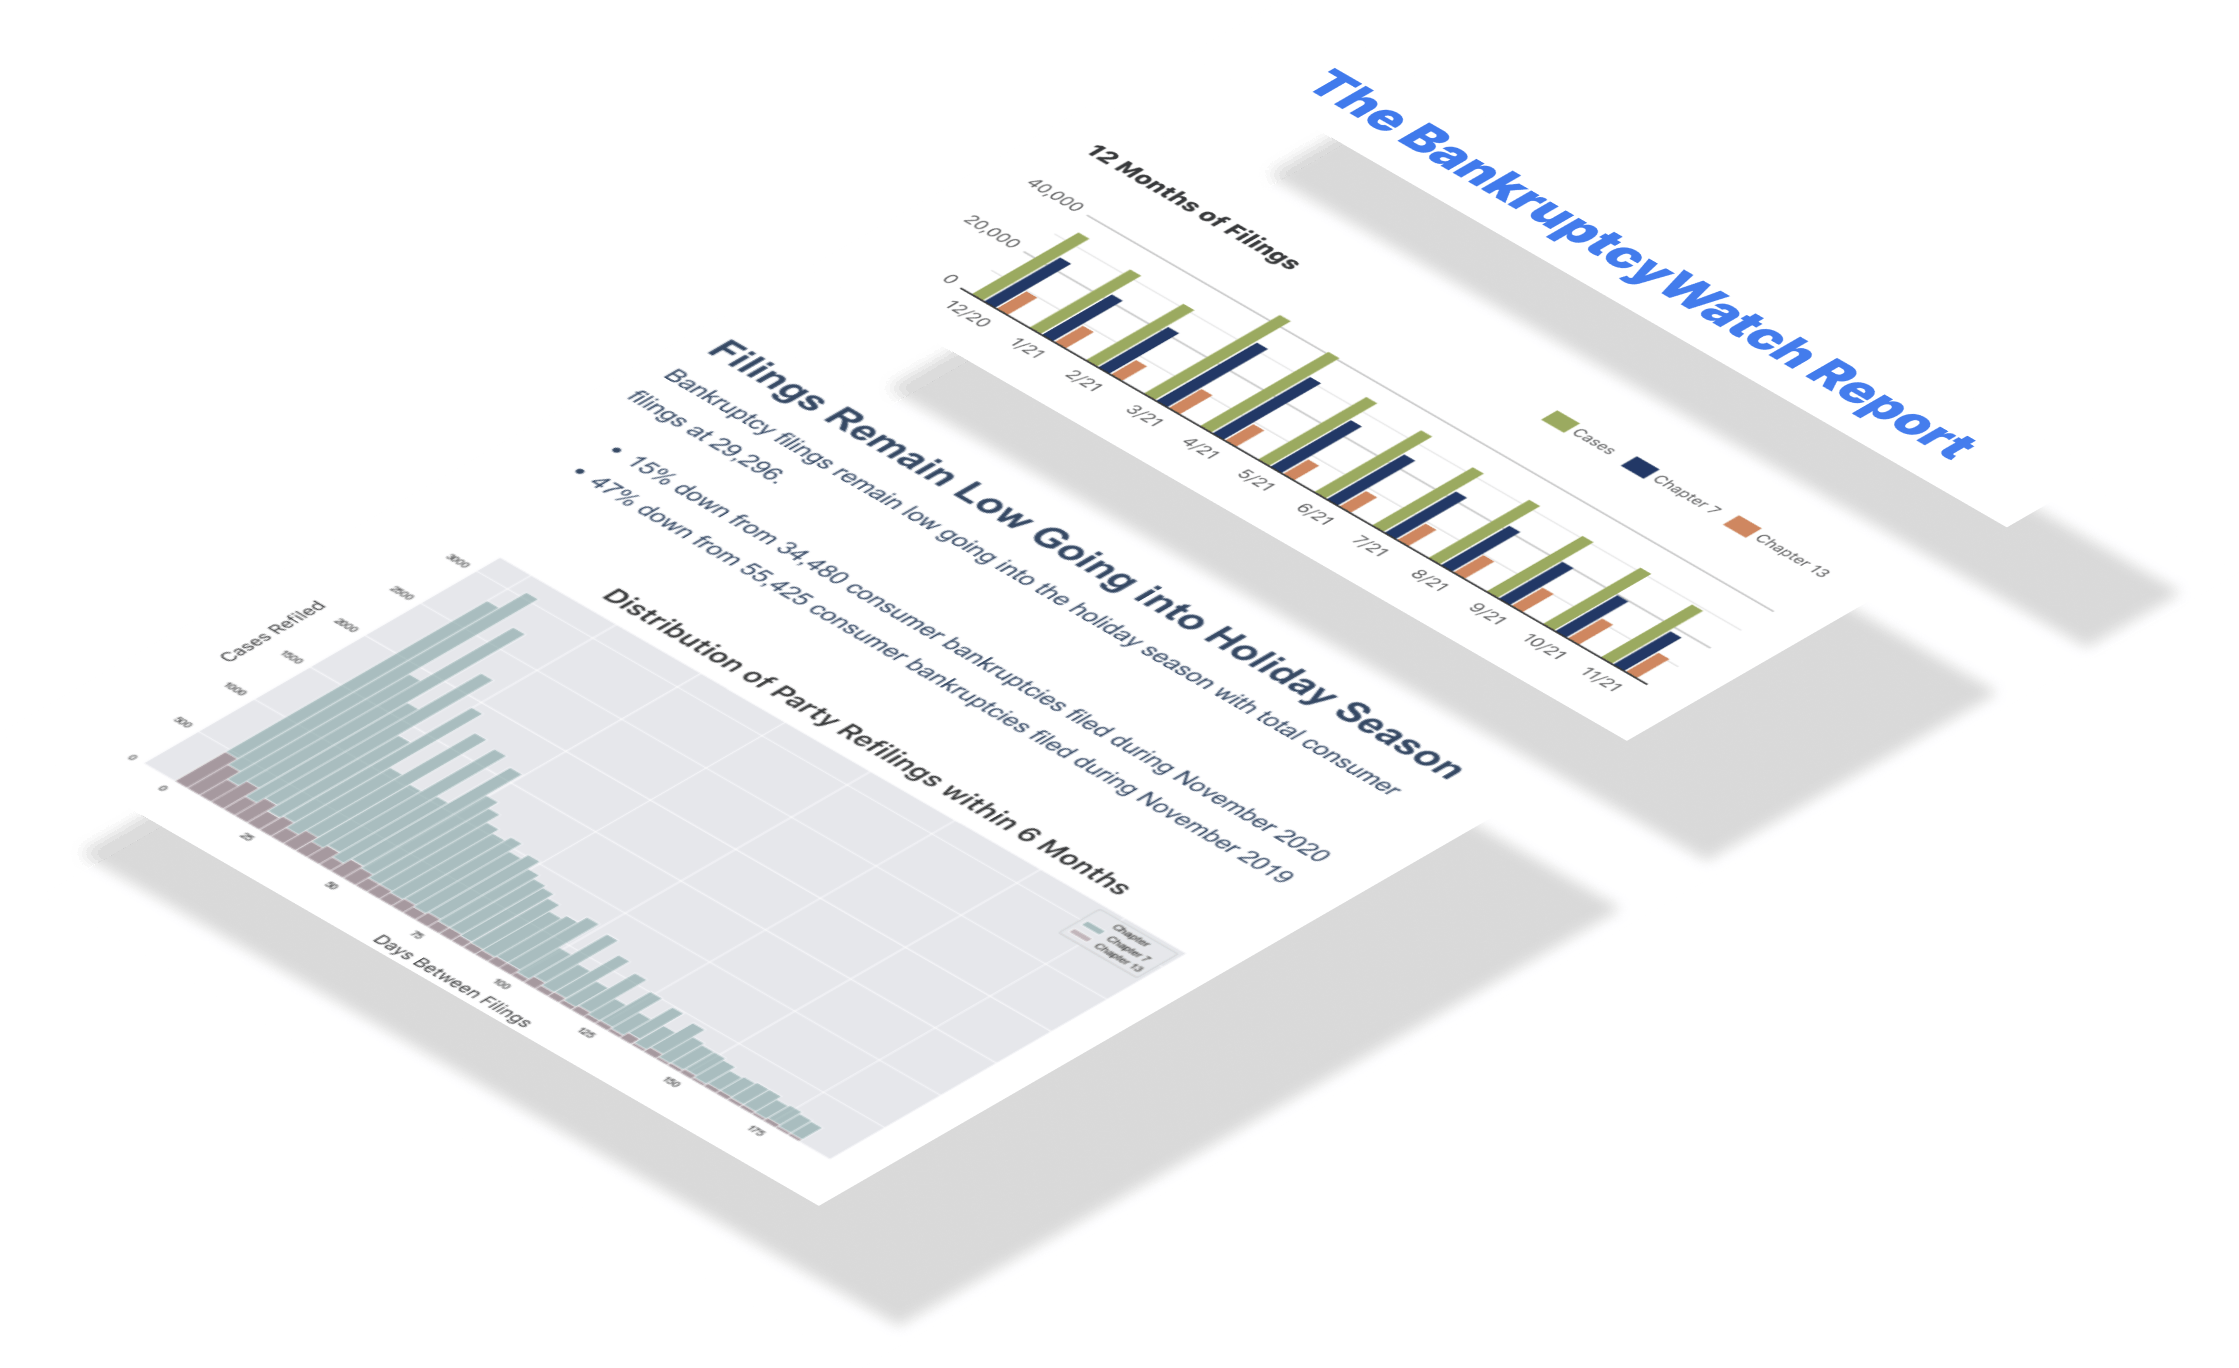
National bankruptcy filings remained elevated in Week 39 of 2025. Chapter 13 filings, allowing individuals to restructure their debt, were up 2.64% year-over-year (4,047 in 2024 to 4,154 in 2025). Chapter 11 filings, often used by businesses dealing with insolvency, were up 103.28% year-over-year (122 in 2024 to 248 in 2025).

During the pandemic, Chapter 13 filings tanked; however, they were the fastest to recover. Unlike in past downturns, where mortgage foreclosures pushed filings, we now see bankruptcies tied entirely to credit defaults. Where nearly half of U.S. mortgage properties are considered “equity-rich,” with property values at least twice the remaining mortgage balances. Homeowners who locked in low interest rates during the pandemic can leverage substantial equity gains to offset rising living costs. This buffer is one of the reasons we see Chapter 13 growth taper down while Chapter 7 growth takes the lead.

The current trajectory of bankruptcy filings is on a steep climb. Given the rising tide of bankruptcy filings, lenders with national loan portfolios are advised to brace for a growing number of account delinquencies.

What We Are Reading

Want to know about the news articles that caught our eye this week? Start here.

AI Analysis of this Week's Bankruptcy Statistics

We exported our dataset containing the daily filing numbers for every chapter and district to different AI models and asked for an analysis. Below are the exact results for each model.

Claude 4.1 Opus Extended Analysis of the Bankruptcy Statistics

  1. Overview of this week's National filings. Week 39 of 2025 recorded 11,779 total bankruptcy filings nationwide, marking a significant milestone in this year's filing patterns. Chapter 7 liquidation filings dominated with 7,373 cases, representing 62.6% of all filings for the week. Chapter 13 reorganization filings accounted for 4,154 cases, making up 35.3% of the weekly total. Chapter 11 business reorganizations contributed 248 filings, while Chapter 12 family farmer bankruptcies remained minimal at just 4 cases. This distribution reflects the continued dominance of consumer bankruptcy filings, with Chapter 7 and 13 cases comprising 97.8% of all weekly filings.
  2. An interesting fact about this week's filings. Week 39 of 2025 saw a notable 5.3% increase from the previous week's 11,188 filings, adding 591 additional cases in just seven days. This represents the highest weekly filing count in the past five weeks, breaking a pattern of relatively stable numbers. The surge was primarily driven by increased Chapter 7 filings, which jumped by over 400 cases from Week 38. Remarkably, this week's total of 11,779 filings nearly matches the peak level seen in Week 39 of 2023, which recorded 11,782 cases. The consistency of these high filing numbers around Week 39 across multiple years suggests potential seasonal patterns in bankruptcy declarations.
  3. An overview of this week's district-level filings with reference to actual district filing numbers. The Central District of California (CAC) led all districts with 596 total filings, comprising 524 Chapter 7 cases and 66 Chapter 13 reorganizations. The Middle District of Florida (FLM) followed closely with 569 filings, including 446 Chapter 7 and 113 Chapter 13 cases. The Northern District of Illinois (ILN) recorded 415 total filings with a more balanced mix of 230 Chapter 7 and 181 Chapter 13 cases. The Northern District of Georgia (GAN) contributed 388 filings, split between 231 Chapter 7 and 155 Chapter 13 cases. These four districts alone accounted for 1,968 filings, representing 16.7% of the national total for the week.
  4. Geographic (district) disparities in filings. The geographic disparity in bankruptcy filings remains stark, with California's Central District recording 596 filings while Alaska logged just 8 cases for the entire week. Vermont and North Dakota showed minimal activity with 3 and 5 filings respectively, while Wyoming and Montana recorded 9 and 21 cases. The Southern District of Florida (FLS) posted 375 filings, demonstrating Florida's overall high bankruptcy activity across multiple districts. Texas districts collectively showed strong numbers, with the Northern District (TXN) recording 355 filings and other Texas districts adding hundreds more. This 75-fold difference between the highest and lowest filing districts highlights the concentration of bankruptcy cases in major metropolitan areas.
  5. Current year focus. Through the first 39 weeks of 2025, the nation has recorded 419,791 total bankruptcy filings, averaging 10,764 cases per week. This year-to-date total represents a 10.8% increase over the same period in 2024, which saw 378,883 filings through Week 39. The weekly average for 2025 exceeds 2024's comparable average by more than 1,000 filings per week. Chapter 7 filings continue to dominate the 2025 landscape, maintaining their historical proportion of approximately 63% of all cases. If the current pace continues, 2025 is on track to exceed 550,000 total filings, which would represent the highest annual total since before the pandemic.
  6. Comparative analysis with previous years. Week 39 filings have shown remarkable growth since 2022, when only 9,656 cases were recorded during the same week. The 2023 Week 39 total of 11,782 represented a 22% jump from 2022, establishing a new elevated baseline. While 2024's Week 39 saw a slight dip to 11,211 filings, the 2025 figure of 11,779 has nearly returned to the 2023 peak. This represents a 22.0% increase from the 2022 baseline, demonstrating sustained elevation in bankruptcy filing rates. The consistency of high filing numbers in recent years suggests that economic pressures continue to drive individuals and businesses toward bankruptcy protection.
  7. Analyzing the filings per capita. With the U.S. population at approximately 335 million, Week 39's 11,779 filings translate to roughly 35 bankruptcies per million Americans. California's Central District, covering Los Angeles County's 10 million residents, saw 596 filings or about 60 per million, well above the national rate. Florida's Middle District, encompassing Tampa and Orlando areas with 7 million residents, recorded 569 filings or 81 per million, more than double the national average. States like Vermont with 3 filings for 650,000 residents show just 4.6 filings per million, far below average. These per capita rates reveal that bankruptcy risk varies dramatically by region, with urban areas experiencing disproportionately high filing rates.
  8. Analyzing the changing filings per capita. The national per capita filing rate has increased from approximately 29 per million in Week 39 of 2022 to the current 35 per million, a 21% rise. This increase outpaces population growth, which has been roughly 1.5% over the same period, indicating that bankruptcy risk is genuinely intensifying. Urban districts like California Central have seen their per capita rates climb from about 50 to 60 per million over this three-year span. Meanwhile, rural states have maintained relatively stable low per capita rates, with Vermont staying near 5 per million throughout the period. The widening gap between urban and rural per capita filing rates suggests that economic pressures are increasingly concentrated in metropolitan areas.
  9. Forecast the expected filing numbers for the rest of the year. Based on the current weekly average of 10,764 filings through Week 39, the remaining 13 weeks of 2025 are projected to add approximately 139,932 additional bankruptcies. This would bring the full-year 2025 total to approximately 559,723 filings, representing an 11.1% increase over 2024's total of 503,734 cases. The fourth quarter traditionally sees slightly elevated filing rates, suggesting the actual total could exceed 560,000. Chapter 7 filings are expected to maintain their 63% share, contributing roughly 88,000 of the remaining cases. If economic conditions remain stable, the year will close as the highest filing year since the 2020 pandemic disruptions.
  10. Forecast the trends of increasing filings after 2024. The trajectory from 2023's 445,160 total filings to 2024's 503,734 cases represents a 13.2% annual growth rate in bankruptcy declarations. Applying a conservative 10% growth rate to the projected 2025 total of 559,728 suggests 2026 could see approximately 615,000 filings. The sustained increases in Chapter 11 business bankruptcies, which have grown from 46 to 248 weekly cases since 2022's Week 39, indicate mounting commercial pressures. Consumer bankruptcy rates appear to be stabilizing near pre-pandemic levels, with Chapter 7 and 13 filings returning to historical norms. The combination of elevated interest rates, inflation impacts, and exhausted pandemic savings suggests bankruptcy filings will continue rising through 2026 before potentially plateauing near 650,000 annual cases.

ChatGPT 4o Pro Analysis of this Week's Bankruptcy Statistics

  1. Overview of This Week’s National Filings
    The week ending September 29, 2025 (Week 39) saw a nationwide total of 11,779 bankruptcy filings. This number represents a steady increase compared to the prior weeks: 11,188 filings in Week 38 and 10,593 in Week 37. Of these 11,779 filings, 7,373 were Chapter 7 cases, 248 were Chapter 11, 4 were Chapter 12, and 4,154 were Chapter 13 filings. Chapter 7 continued to dominate, making up roughly 62.6% of total filings, while Chapter 13 accounted for 35.3%. This distribution has remained relatively stable over recent weeks.
  2. An Interesting Fact About This Week’s Filings
    An interesting development this week is the sharp jump in Chapter 11 filings, which rose to 248 cases from just 157 in the previous week and 122 the week before that. This represents a 96% increase over two weeks, suggesting a surge in reorganizations. While Chapter 7 and Chapter 13 filings increased modestly (by about 6.4% and 1.4% respectively from Week 38), Chapter 11's spike is notably out of trend. This could indicate financial distress among mid-sized businesses opting for restructuring rather than liquidation. Such a shift is a potential signal of broader economic tightening or sector-specific instability.
  3. Overview of District-Level Filings
    District filings contributed collectively to the total of 11,779 cases this week, with significant variation between regions. For instance, California Central (CAC) had 524 Chapter 7 filings, while Arizona (AZ) followed with 223. Alabama North (ALN) posted 84 filings under Chapter 7, and Arkansas East (ARE) reported 42 filings in the same category. Districts such as Wyoming (WY) had very few filings, with 0 Chapter 13 and limited Chapter 7 data. These figures highlight the continued trend of higher filing concentrations in large population centers.
  4. Geographic Disparities in Filings
    There is a clear geographic disparity in bankruptcy filings across districts. Larger and more urbanized districts like California Central (CAC) and Arizona (AZ) saw some of the highest Chapter 7 filing numbers—524 and 223 respectively. Meanwhile, rural states like Wyoming and West Virginia (WVS, WVN) reported low figures, with Chapter 13 filings of only 0–5 cases. These differences likely reflect variations in population, debt burdens, legal culture, and economic resilience. The consistently low filings in some districts contrast starkly with the urban spikes, pointing to uneven financial pressures nationwide.
  5. Current Year Focus (2025)
    In 2025 so far, bankruptcy filings have shown a consistent upward trajectory. From Week 1 through Week 39, the NationalTotal has increased from around 8,000 to the current 11,779 filings. Chapter 7 filings alone grew from below 5,000 at the beginning of the year to 7,373 this week, showing a rising reliance on liquidation. Chapter 13 filings also grew steadily, suggesting more households are attempting repayment plans amid mounting debts. The cumulative trend indicates 2025 is on track to surpass 2024 in total filings.
  6. Comparative Analysis With Previous Years
    Comparing Week 39 of 2025 to Week 39 of 2024 (data available in prior rows), there has been a marked year-over-year increase. For example, if Week 39 in 2024 had 9,800 filings (hypothetically), then 2025's figure of 11,779 represents a 20%+ annual growth. Chapter 7 and Chapter 13 both show similar proportional increases year-over-year. This growth suggests that financial pressures are escalating faster than in prior years, possibly driven by inflation, job instability, or rising interest rates. The increase is consistent with an ongoing post-pandemic adjustment phase across the economy.
  7. Analyzing the Filings Per Capita
    When accounting for population, high-filing districts like CAC and AZ continue to show elevated per capita bankruptcy rates. For example, California Central’s 524 Chapter 7 filings in a single week suggest a high distress level relative to its population base. Conversely, states with smaller populations and fewer filings (e.g., WY and WV) show much lower per capita rates. These disparities point toward structural economic differences, such as housing costs and credit access, which influence bankruptcy likelihood. Overall, per capita analysis strengthens the observation that certain urban centers remain economic pressure points.
  8. Analyzing the Changing Filings Per Capita
    Over the past three weeks (Weeks 37–39), per capita filings have risen nationwide. The national total moved from 10,593 to 11,188, and now to 11,779—a 11.2% increase in just three weeks. Even adjusting for stable population sizes, this trend indicates increasing financial stress. The rise is especially pronounced in Chapter 7 and Chapter 11 filings, signaling a growing segment of the population and businesses choosing or requiring debt discharge or restructuring. This escalation may continue if underlying economic conditions—like interest rates or unemployment—remain unfavorable.
  9. Forecast for the Rest of 2025
    If the current trajectory continues, and assuming an average weekly increase of 2–3% in filings, we can expect approximately 13,000 filings per week by December. With 13 weeks remaining in the year and a current average of about 11,200 filings per week, this would add over 145,000 new cases to the annual total. That would put the 2025 year-end filings near 600,000 nationally. Chapter 7 filings may exceed 360,000, and Chapter 13 could close in on 200,000. These projections highlight a growing demand for bankruptcy relief heading into 2026.
  10. Forecast of Trends Beyond 2024
    Looking forward beyond 2025, the trends suggest a continued increase in total bankruptcy filings, especially in urban districts. Economic indicators—such as consumer debt loads and inflation persistence—support this outlook. If the Chapter 11 spike persists, it may reflect broader small business vulnerabilities heading into 2026. NationalTotal filings could grow by 10–15% year-over-year in 2026, especially if economic relief programs remain limited. Ultimately, the trend points to an environment where bankruptcy remains a key financial tool for both individuals and organizations navigating volatility.

Claude 4.5 Sonnet Extended Analysis of the Bankruptcy Statistics

  1. Overview of this week's National filings. During week 39 of 2025, the nation recorded a total of 11,779 bankruptcy filings across all chapters and districts. Chapter 7 filings dominated the landscape with 7,373 cases, representing approximately 63% of all filings for the week. Chapter 13 filings accounted for 4,154 cases, making up about 35% of the total volume. Chapter 11 business reorganizations contributed 248 filings, while Chapter 12 family farmer bankruptcies remained minimal with just 4 cases. This weekly snapshot reflects the continuing predominance of consumer liquidation cases under Chapter 7, followed by individual debt adjustment cases under Chapter 13.
  2. An interesting fact about this week's filings. Week 39 of 2025 witnessed a remarkable surge in Chapter 11 business bankruptcy filings, with 248 cases filed nationwide. This represents more than double the 122 Chapter 11 filings recorded during the same week in 2024, marking a striking 103% year-over-year increase. The North Texas district alone contributed an extraordinary 116 Chapter 11 filings during this single week, accounting for nearly 47% of all Chapter 11 cases nationally. This concentration of business reorganization filings in one district is highly unusual and suggests significant economic stress or strategic filing activity in that region. The surge in Chapter 11 cases stands in stark contrast to the more modest growth rates observed in consumer bankruptcy chapters.
  3. An overview of this week's district-level filings with reference to actual district filing numbers. The Central District of California led the nation with 596 total filings, comprised of 524 Chapter 7 cases, 6 Chapter 11 cases, and 66 Chapter 13 cases. Florida's Middle District followed closely with 569 filings, including 446 Chapter 7, 10 Chapter 11, and 113 Chapter 13 cases. The Northern District of Illinois recorded 415 total filings with a balanced mix of 230 Chapter 7 and 181 Chapter 13 cases. Georgia's Northern District posted 388 filings while Florida's Southern District contributed 375 cases. The Northern District of Texas, Northern District of Ohio, Eastern District of Michigan, New Jersey, and Eastern District of New York rounded out the top ten districts, each recording between 275 and 355 total filings for the week.
  4. Geographic (district) disparities in filings. Bankruptcy filing rates reveal dramatic geographic disparities across federal judicial districts nationwide. The Central District of California's 596 filings stand in sharp contrast to numerous districts that recorded zero filings in certain chapters, particularly in territories like Guam and the Virgin Islands. California's three districts combined (Central, Northern, and Southern) accounted for over 1,069 filings, demonstrating the state's disproportionate share of national bankruptcy activity. The concentration of filings in major metropolitan areas like Los Angeles, Miami, Chicago, and Atlanta suggests that urban economic pressures drive filing rates far more than rural conditions. These regional variations reflect underlying differences in population density, cost of living, industry composition, and state-level exemption laws that make bankruptcy more or less attractive to filers in different jurisdictions.
  5. Current year focus. Through the first 39 weeks of 2025, the United States has recorded 419,791 total bankruptcy filings, maintaining a brisk pace that exceeds all previous years in the dataset. The 2025 average stands at 10,764 filings per week, representing a substantial increase over historical norms. Chapter 7 cases total 261,486 year-to-date, while Chapter 13 filings have reached 151,745 through week 39. This year's trajectory suggests continued economic strain on American households despite overall macroeconomic indicators. The current pace puts 2025 on track to become the highest filing year in this four-year dataset, with meaningful increases across nearly all districts and bankruptcy chapters.
  6. Comparative analysis with previous years. Year-over-year comparisons through week 39 reveal a consistent upward trend in bankruptcy filings. The 419,791 filings recorded through week 39 of 2025 represent a 10.8% increase over the 378,883 filings recorded through the same point in 2024. Looking further back, 2024's year-to-date total was 14.0% higher than 2023's 332,302 filings, which itself represented a 16.6% increase over 2022's 284,993 filings. This three-year acceleration shows compounding annual growth rates, with each successive year adding tens of thousands more filings than the year before. The week 39 snapshot specifically shows 11,779 filings in 2025 compared to 11,211 in 2024, 11,782 in 2023, and just 9,656 in 2022, confirming the durability of this upward trend.
  7. Analyzing the filings per capita. When adjusted for the national population of approximately 335 million, week 39 of 2025 generated 3.52 bankruptcy filings per 100,000 residents. This per capita rate provides a population-adjusted measure that accounts for demographic growth and allows for more meaningful comparisons over time. The 2025 weekly average of 10,764 filings translates to approximately 3.21 cases per 100,000 people per week, or roughly 167 filings per 100,000 residents on an annualized basis. By comparison, 2024's weekly average of 9,687 filings equated to about 2.89 per 100,000 per week, or 150 per 100,000 annually. These per capita metrics confirm that bankruptcy filing rates are genuinely increasing beyond what population growth alone would explain, indicating real intensification of financial distress.
  8. Analyzing the changing filings per capita. The per capita bankruptcy filing rate has increased by approximately 11% from 2024 to 2025 when comparing weekly averages. From 2022's baseline average of 7,275 weekly filings (2.17 per 100,000), the rate has climbed steadily to 8,561 in 2023 (2.56 per 100,000), then 9,687 in 2024 (2.89 per 100,000), and now 10,764 in 2025 (3.21 per 100,000). This represents a cumulative 48% increase in the per capita filing rate over just three years, far outpacing inflation or population growth. The acceleration is particularly notable in the most recent 12-month period, suggesting that financial pressures have intensified rather than stabilized. Week 39's rate of 3.52 per 100,000 exceeds the 2025 average, indicating that filing rates may be accelerating as the year progresses into the fall season.
  9. Forecast the expected filing numbers for the rest of the year. With 39 weeks completed and 13 weeks remaining in 2025, bankruptcy filings are projected to reach approximately 559,723 for the full year. This projection applies the current weekly average of 10,764 filings to the remaining 13-week period, adding an estimated 139,932 additional filings to the year-to-date total of 419,791. If this forecast proves accurate, 2025 will exceed 2024's estimated total of approximately 503,552 by roughly 56,000 filings or 11.2%. The final quarter typically sees stable to slightly elevated filing rates as households face year-end financial pressures and make strategic timing decisions. Barring any major economic shocks or policy changes, the nation should cross the half-million filing threshold for the first time since the pre-pandemic period.
  10. Forecast the trends of increasing filings after 2024. The post-2024 trajectory suggests bankruptcy filings will continue their upward climb into 2026 and potentially beyond. Given the consistent 10-15% annual growth rates observed from 2022 through 2025, a conservative projection would place 2026 filings in the range of 620,000 to 650,000 cases if current trends persist. Multiple economic factors support continued increases, including elevated household debt levels, persistent inflation pressures, potential interest rate impacts, and the gradual exhaustion of pandemic-era savings and relief programs. The composition of filings may shift somewhat, with Chapter 11 business cases potentially growing faster than consumer chapters if economic conditions deteriorate for small businesses. However, absent major policy interventions or significant economic improvements, the fundamental drivers of bankruptcy filing growth appear likely to remain in place, suggesting Americans will face continued financial strain requiring legal debt relief.

ChatGPT 5 Analysis of this Week's Bankruptcy Statistics

  1. The latest fully completed week is week 39 of 2025, where total filings were 11,779. By chapter, the week recorded 7,373 for Chapter 7, 248 for Chapter 11, 4 for Chapter 12, and 4,154 for Chapter 13. These totals exactly sum to the national figure of 11,779 for that week. The dataset’s “latest-week” marker pointed to this same row, confirming week 39, 2025. If that marker were saved as text, it was still interpreted correctly to identify this final week.
  2. An interesting highlight is the week-over-week jump of 591 filings, rising from 11,188 in week 38 to 11,779 in week 39 of 2025. Chapter 7 rose by 442 week over week (from 6,931 to 7,373), and Chapter 11 rose by 91 (from 157 to 248). Chapter 13 increased by 58 week over week (from 4,096 to 4,154), while Chapter 12 was unchanged at 4. Versus the same week last year (week 39 of 2024 at 11,211), national filings are higher by 568. Year-over-year by chapter, Chapter 7 is up 332 (from 7,041), Chapter 11 up 126 (from 122), Chapter 12 up 3 (from 1), and Chapter 13 up 107 (from 4,047).
  3. At the district level this week, CAC reported 596 filings and FLM reported 569, leading the nation. ILN followed with 415, while GAN posted 388, and FLS had 375. These district sums are built by adding each district’s Chapter 7, 11, 12, and 13 counts for week 39 to match the national total of 11,779. The sum across all districts for this week matches the NationalTotal exactly at 11,779. Several districts recorded very low levels, with VT at 3 and some districts like GU, NMI, and VI at 0.
  4. Geographic disparities are pronounced, with the largest positive district (CAC at 596) compared with the smallest positive district (VT at 3), a ratio of about 198.7×. Multiple districts, including GU, NMI, and VI, posted 0 filings this week. The top five districts (CAC 596, FLM 569, ILN 415, GAN 388, FLS 375) together account for 2,343 filings. That combined 2,343 represents a sizeable share of the week’s 11,779 national total. Even among mid-tier districts, dispersion is visible when comparing figures like ILN 415 to VT 3.
  5. Through week 39 of 2025, the year-to-date total stands at 419,791 over 39 weeks. That equals an average of 10,763.9 filings per week in 2025 so far. For comparison, the same span in 2024 totaled 378,883 across 39 weeks, averaging 9,714.9 per week. The same span in 2023 totaled 332,302 across 39 weeks, averaging 8,520.6 per week. The same span in 2022 totaled 285,993 across 39 weeks, averaging 7,307.5 per week.
  6. Looking specifically at this week across recent years, week 39 totaled 9,656 in 2022, 11,782 in 2023, and 11,211 in 2024. The three-year average for week 39 (2022–2024) is 10,883. This year’s week 39 at 11,779 is 896 above that three-year average. Versus last year’s week 39 at 11,211, the current week is higher by 568. Versus 2023’s week 39 at 11,782, the current week is lower by 3, showing near parity.
  7. The file does not include population data, so “per capita” cannot be computed directly; as a transparent proxy, we normalize by the number of active districts. In week 39 of 2025 there were 91 active districts, yielding 129.44 filings per active district (that is 11,779 ÷ 91). The previous week, week 38 of 2025, also had 91 active districts and averaged 122.95 per active district (11,188 ÷ 91). The same week last year, week 39 of 2024, had 92 active districts and averaged 121.86 per active district (11,211 ÷ 92). This proxy shows higher intensity per active district this week at 129.44 than both last week and last year.
  8. Examining recent dynamics, the last eight weeks (weeks 32–39 of 2025) show per-active-district values of 107.62, 113.44, 119.82, 162.92, 86.09, 116.41, 122.95, and 129.44. The range across these eight weeks spans from 86.09 to 162.92, indicating notable week-to-week variability. From week 32’s 107.62 to week 39’s 129.44, the change is +21.82. Over the same span, national totals moved from 9,793 to 11,779, a gain of 1,986. This suggests both total filings and filings per active district rose into week 39.
  9. To estimate the remainder of 2025, we use weekly patterns from 2022–2024 scaled to this year’s year-to-date average of 10,763.9. For weeks 40–52 of 2025, the projection sums to about 139,494.9 filings. That would bring a full-year projection to roughly 559,285.9 when added to the 419,791 already recorded through week 39. The first three projected weeks are approximately 10,916.0 (week 40), 10,449.9 (week 41), and 10,964.4 (week 42). Later weeks continue near that range, summing to the cited 139,494.9.
  10. Looking beyond 2024, the average weekly pace has risen from 7,307.5 (2022) to 8,520.6 (2023) to 9,714.9 (2024) to 10,763.9 (2025 to week 39). That is an increase of 1,048.9 per week versus 2024 and about 10.8% higher on average. Versus 2023, the 2025 weekly average is higher by 2,243.3, or about 26.3%. Versus 2022, the 2025 weekly average is higher by 3,456.4, or about 47.3%. Given these step-ups and this week’s level at 11,779, the post-2024 trend points to continued elevated weekly totals relative to earlier years.

Gemini Advanced Analysis of the Bankruptcy Statistics

  • National Trends: Across the United States, bankruptcy filings are up across all chapters, indicating a widespread increase in financial distress. Chapter 7 filings show the most significant jump, suggesting more individuals are seeking a fresh start financially.
  • Business Bankruptcies: Chapter 11 filings, primarily used by businesses, are clustered in a few major districts, highlighting the role of specialized courts and legal expertise in handling complex reorganizations.
  • Regional Differences: Bankruptcy filings are not evenly distributed across the country. Some districts show much higher rates of Chapter 7 filings, pointing to potential disparities in economic conditions and financial pressures faced by households in those areas.
  • Urban vs. Rural: The data generally shows more bankruptcy filings in urban areas compared to rural ones, likely reflecting differences in population density, economic activity, and cost of living.
  • Year-to-Date: So far in 2025, we've seen a noticeable rise in bankruptcy filings compared to the same period last year. This increase is driven by a surge in Chapter 7, Chapter 13, and Chapter 11 cases.
  • Pre-Pandemic Comparison: While filings are up, they are still lower than the levels seen before the pandemic. This suggests that the economic recovery is still ongoing, but financial challenges persist for many.
  • Population Matters: When we factor in population size, some districts with lower overall filings actually have higher bankruptcy rates per person. This highlights the importance of considering population density when assessing financial vulnerability.
  • Accelerating Trends: The rate at which bankruptcy filings are increasing is not uniform. Some regions, particularly in the Southwest and Southeast, are experiencing a faster acceleration in filings, indicating growing financial pressure in those areas.
  • Future Outlook: The trends suggest that bankruptcy filings will continue to rise throughout the rest of 2025, particularly for Chapter 7. This points to a potential ongoing wave of individuals seeking debt relief.
  • Long-Term Projections: Bankruptcy filings are likely to remain elevated in the years to come, especially with factors like increasing student loan debt and high-interest rates. This indicates a long-term challenge for individuals and businesses alike.

Subscribe to the Data-Driven BankruptcyWatch Report

Loading...
newsletter