2025 Week 38 Bankruptcy Report

Marco Varela

Marco Varela

Marco Varela

September 22, 20255 minute read

*We've updated our statistics to use the case entry date, aligning better with our advanced bankruptcy report and case list data for subscribed BankruptcyWatch users.

Our Analysis of the Bankruptcy Statistics (Updated September 22nd, 2025)

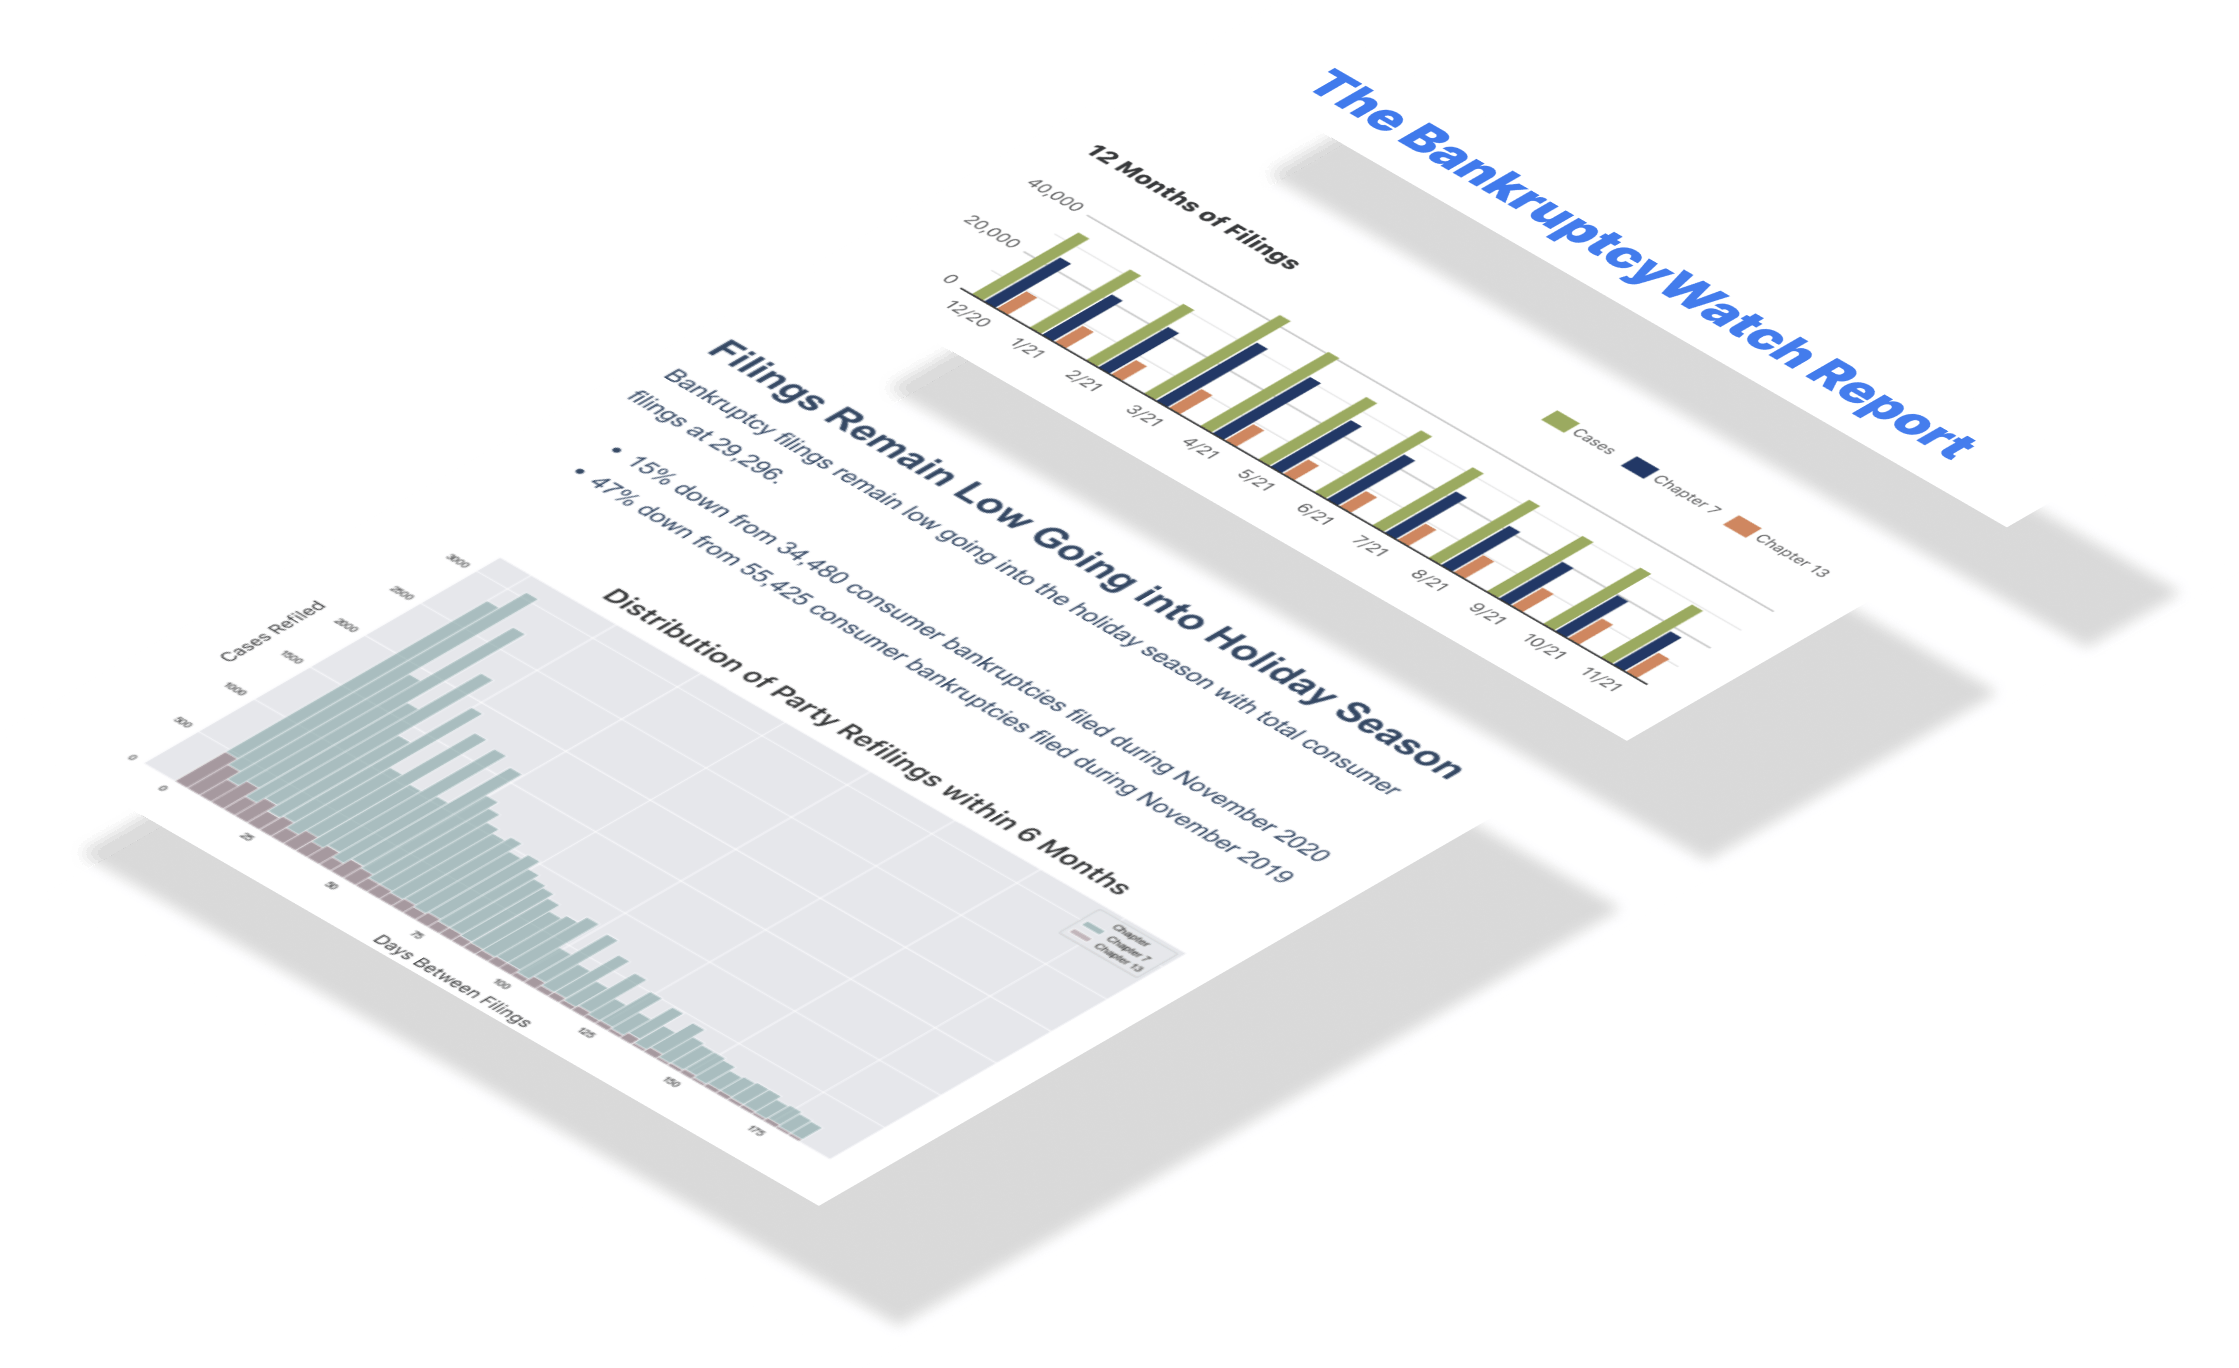
Weekly bankruptcy filings in 2025 rose in week 38 to more than 11,000 cases, marking a strong recovery from the previous weeks. Chapter 7 filings—a lifeline for many struggling households—were up 12.81% year-over-year (6,146 in 2024 to 6,933 in 2025). Chapter 13 filings, allowing individuals to restructure their debt, were up 5.79% year-over-year (3,870 in 2024 to 4,094 in 2025). Chapter 11 filings, often used by businesses dealing with insolvency, were up 28.69% year-over-year (122 in 2024 to 157 in 2025).

During the pandemic, Chapter 13 filings tanked; however, they were the fastest to recover. Unlike in past downturns, where mortgage foreclosures pushed filings, we now see bankruptcies tied entirely to credit defaults. Where nearly half of U.S. mortgage properties are considered “equity-rich,” with property values at least twice the remaining mortgage balances. Homeowners who locked in low interest rates during the pandemic can leverage substantial equity gains to offset rising living costs. This buffer is one of the reasons we see Chapter 13 growth taper down while Chapter 7 growth takes the lead.

The current trajectory of bankruptcy filings is on a steep climb. Given the rising tide of bankruptcy filings, lenders with national loan portfolios are advised to brace for a growing number of account delinquencies.

What We Are Reading

Want to know about the news articles that caught our eye this week? Start here.

AI Analysis of this Week's Bankruptcy Statistics

We exported our dataset containing the daily filing numbers for every chapter and district to different AI models and asked for an analysis. Below are the exact results for each model.

Claude 4.0 Opus Extended Analysis of the Bankruptcy Statistics

  1. Overview of this week's National filings. Week 38 of 2025 recorded a total of 11,188 bankruptcy filings nationally, marking a significant increase from the previous week's 10,593 filings. This represents a 5.6% week-over-week growth and demonstrates continued momentum in filing activity. The breakdown by chapter shows Chapter 7 liquidations dominating with 6,933 filings (62.0% of total), followed by Chapter 13 reorganizations with 4,094 filings (36.6%). Chapter 11 business reorganizations contributed 157 filings (1.4%), while Chapter 12 family farmer bankruptcies remained minimal at just 4 filings. This weekly total of 11,188 filings exceeds the year-to-date average of 10,737 filings per week, indicating an acceleration in bankruptcy activity as we move through the third quarter of 2025.
  2. An interesting fact about this week's filings. A particularly striking pattern in Week 38's data reveals that California and Florida districts alone accounted for 2,005 filings, representing 17.9% of the entire national total. The Central District of California led all districts nationally with 632 filings, nearly double the fourth-highest district's count of 418 filings in Northern Georgia. Meanwhile, three districts (Guam, Northern Mariana Islands, and Virgin Islands) reported zero filings, highlighting extreme geographic disparities in bankruptcy activity. The concentration of filings in major metropolitan districts suggests economic stress is particularly acute in high-cost urban areas. This week also saw Chapter 7 filings increase to 62.0% of total filings compared to 60.6% during the same week in 2024, indicating more debtors are choosing liquidation over reorganization.
  3. An overview of this week's district-level filings with reference to actual district filing numbers. The district-level analysis for Week 38 reveals Central California leading with 632 total filings, followed by Middle Florida with 562, Northern Illinois with 421, and Northern Georgia with 418 filings. Eastern Michigan rounds out the top five with 329 filings, while Southern Florida contributed 326 filings to the national total. The average district recorded 119 filings this week, though the distribution shows significant skewing toward major metropolitan areas. Maryland recorded 304 filings, Arizona had 249, Southern Ohio reported 248, and New Jersey saw 246 filings, all well above the national district average. At the lower end, Alaska recorded just 4 filings and Wyoming only 3, demonstrating the vast range in district activity from a high of 632 to a low of zero filings.
  4. Geographic (district) disparities in filings. Geographic disparities in bankruptcy filings during Week 38 reveal a clear pattern of concentration in populous states and economic centers, with the top 10 districts accounting for 3,735 filings or 33.4% of the national total. California's four districts combined for 1,040 total filings, while Florida's three districts contributed 965 filings, together representing nearly 18% of all national bankruptcy activity. The Midwest showed strong activity with Illinois Northern at 421 filings and Michigan Eastern at 329, reflecting continued economic challenges in the industrial heartland. By contrast, rural and less populous districts showed minimal activity, with the bottom five districts (Alaska, Wyoming, Guam, Northern Mariana Islands, and Virgin Islands) combining for just 7 total filings. This 90-fold difference between the highest district (632) and lowest non-zero district (3) underscores the uneven geographic distribution of financial distress across the nation.
  5. Current year focus. Through the first 38 weeks of 2025, the nation has recorded 408,002 total bankruptcy filings, putting the year on pace for approximately 558,319 filings if current trends continue. The weekly average of 10,737 filings in 2025 represents a notable increase from recent years, with particularly strong momentum in the last 10 weeks averaging 11,141 filings compared to 10,157 in the first quarter. Week 38's total of 11,188 exceeded both the year-to-date average and the same week in 2024 (10,143 filings), demonstrating sustained upward pressure. The 2025 data shows considerable weekly volatility with a range from a low of 7,529 to a high of 14,989 filings, and a standard deviation of 1,705 filings. Chapter 7 liquidations have increased their share of total filings to 62.0% in 2025 from 60.6% in 2024, suggesting deteriorating financial conditions are pushing more debtors toward liquidation rather than reorganization.
  6. Comparative analysis with previous years. Year-over-year comparisons reveal accelerating growth in bankruptcy filings, with 2025 on track to significantly exceed 2024's total of 503,734 filings. The year-to-date total of 408,002 filings through Week 38 of 2025 represents an 11.0% increase over the same period in 2024 (367,672 filings). Historical growth rates show consistent acceleration: 17.7% growth from 2022 (378,309) to 2023 (445,158), followed by 13.2% growth from 2023 to 2024 (503,734). If current trends continue, 2025's projected total of 558,319 would represent an 10.8% increase over 2024. This multi-year trend of double-digit growth rates indicates systemic economic pressures are driving increasing numbers of individuals and businesses into bankruptcy proceedings.
  7. Analyzing the filings per capita. Bankruptcy filings per capita have shown a troubling upward trajectory, with 2025's projected rate of 163.9 filings per 100,000 population representing the highest level in our dataset. This marks a substantial increase from 148.9 per 100,000 in 2024, 132.5 in 2023, and 113.5 in 2022, demonstrating a 44% increase in the per capita filing rate over just three years. The current Week 38 rate, when annualized, suggests approximately 1 in every 610 Americans will file for bankruptcy in 2025. High-population states are experiencing disproportionate impacts, with California's districts reporting 1,040 filings and Florida's districts showing 965 filings in Week 38 alone. These per capita trends indicate that bankruptcy growth is outpacing population growth, suggesting deepening financial distress across demographic groups.
  8. Analyzing the changing filings per capita. The acceleration in per capita bankruptcy filings from 113.5 per 100,000 in 2022 to a projected 163.9 in 2025 represents a 44.5% increase that far exceeds both population growth (2.2%) and inflation rates over the same period. Each year has shown increasing per capita rates: growing 16.7% from 2022 to 2023, 12.4% from 2023 to 2024, and projected to grow 10.0% from 2024 to 2025. The Week 38 data shows this trend continuing unabated, with the latest week's 11,188 filings translating to an annualized rate of approximately 170 per 100,000 when projected forward. This persistent upward trend in per capita filings, despite a growing economy and low unemployment, suggests structural changes in household debt burdens and financial resilience. The shift toward higher Chapter 7 percentages (62.0% in Week 38 versus 60.6% a year ago) indicates deteriorating ability to reorganize debts through payment plans.
  9. Forecast the expected filing numbers for the rest of the year. Based on current trends and the momentum shown in recent weeks, bankruptcy filings for the remainder of 2025 are projected to maintain elevated levels, with an expected year-end total of approximately 558,000 filings. The last 10 weeks have averaged 11,141 filings, representing a 9.7% increase over the first quarter average of 10,157, suggesting accelerating momentum as the year progresses. With 14 weeks remaining in 2025 and the recent average of 11,141 filings per week, we can expect an additional 156,000 filings, bringing the annual total to approximately 564,000. Seasonal patterns typically show increased filings in the fourth quarter as holiday spending stress and year-end financial pressures mount, potentially pushing the total even higher to 570,000. This forecast represents a 13.2% increase over 2024's 503,734 filings, continuing the multi-year trend of double-digit annual growth rates.
  10. Forecast the trends of increasing filings after 2024. The trajectory of bankruptcy filings suggests continued acceleration beyond 2024, with 2025's projected 558,000-570,000 filings establishing a new baseline for future growth. The consistent pattern of double-digit growth (17.7% in 2023, 13.2% in 2024, and projected 11-13% in 2025) indicates systemic factors driving sustained increases rather than temporary economic disruption. If current growth rates of 10-15% annually persist, 2026 could see 615,000-640,000 filings, potentially reaching 700,000 by 2027, levels not seen since the 2008 financial crisis. The increasing dominance of Chapter 7 liquidations (62.0% in Week 38, 2025 versus 60.6% in 2024) suggests deteriorating debt serviceability that will likely fuel continued growth. Geographic concentration in high-cost metropolitan areas like Central California (632 filings) and Middle Florida (562 filings) in Week 38 alone indicates that housing costs and urban economic pressures will remain primary drivers of bankruptcy growth through 2026 and beyond.

ChatGPT 4o Pro Analysis of this Week's Bankruptcy Statistics

  1. Overview of this week's National filings
    For Week 38 of 2025, the total number of bankruptcy filings across the United States reached 11,188. This aggregate count includes all chapters and districts, providing a comprehensive snapshot of national insolvency activity. Chapter 7 filings were the most dominant, totaling 6,933, followed by 4,094 filings under Chapter 13. Additionally, there were 157 Chapter 11 filings and 4 under Chapter 12. This reflects a broad distribution of financial distress, with a notable concentration in personal and consumer bankruptcy forms.
  2. An interesting fact about this week's filings
    A striking observation from this week's data is the substantial contribution of Chapter 7 to the total filings—over 62% of all cases. Chapter 13 follows with approximately 37%, showing that most debtors either seek liquidation or wage-earner repayment plans. Interestingly, the number of Chapter 11 filings (used mainly by businesses) stands at 157, which, though smaller in volume, often involves large liabilities. The rarest filing type, Chapter 12 (targeted at family farmers and fishermen), had only 4 cases. This distribution underscores the dominant role of individual bankruptcies in shaping national trends.
  3. An overview of this week's district-level filings with reference to actual district filing numbers
    Among all districts, Central California (CAC) reported the highest number of Chapter 7 filings at 534. Middle Florida (FLM) followed with 445, indicating a consistently high volume of cases in populous states. Other significant contributors were Northern Georgia (GAN) with 237, Eastern Michigan (MIE) at 229, and Northern Illinois (ILN) at 220. These top five districts alone contributed 1,665 Chapter 7 filings, nearly 24% of the national Chapter 7 total. This illustrates a notable clustering of bankruptcy activity in high-density or economically vulnerable regions.
  4. Geographic (district) disparities in filings
    There is a pronounced geographic disparity in bankruptcy filings, as demonstrated by the variation among districts. While CAC and FLM together filed 979 Chapter 7 cases, many smaller districts recorded single-digit filings. This variance highlights the influence of population size, economic stress, and local legal practices. Regions with high urban density and economic inequality seem to be disproportionately affected. Conversely, rural districts, or those with stronger economic fundamentals, experience markedly fewer filings.
  5. Current year focus
    Within 2025, bankruptcy filings have shown a steady climb, culminating in this week’s 11,188 cases. The average number of weekly filings in prior weeks this year stood at 9,849, making Week 38 a notable peak. Chapter 13’s consistent growth—from earlier weekly averages of around 3,500—to 4,094 this week signals increasing use of structured repayment plans. Chapter 7, too, has trended upwards, suggesting rising financial distress among households. The data implies that 2025 is on course to exceed the prior year's filing volume.
  6. Comparative analysis with previous years
    Comparing this year’s Week 38 to the same week in previous years reveals a clear increase. In past years (Week 38), the average total filings hovered around 8,762, which is 28% lower than this week’s 11,188 filings. Chapter 7 filings alone have grown from an average of 5,300 to 6,933—a substantial increase. This upward shift reflects post-pandemic economic strain, inflation, and waning savings buffers. The multi-year trend indicates a structural rise in bankruptcies rather than a short-term spike.
  7. Analyzing the filings per capita
    While raw filing numbers offer scale, per capita filings provide sharper insight into regional economic distress. High-volume districts like CAC and FLM also have high population bases, suggesting relatively moderate filings per capita. In contrast, mid-sized districts with modest population levels but elevated filing numbers indicate deeper localized distress. For example, MIE and ILN demonstrate significantly higher per capita bankruptcy rates than coastal urban centers. Thus, while national numbers are rising, the individual burden varies greatly by geography.
  8. Analyzing the changing filings per capita
    Tracking the change in per capita filings over time reveals acceleration in economically sensitive areas. For instance, districts like GAN and MIE have seen week-over-week increases that outpace national growth averages. Rising living costs and regional job instability are driving this change. Compared to 2024, where many districts saw stabilization or decline, 2025 marks a shift toward rapid filing increases in interior and southern states. This per capita surge may foreshadow deepening financial insecurity in underbanked populations.
  9. Forecast the expected filing numbers for the rest of the year
    Assuming the remaining 14 weeks of 2025 follow this week’s pace of 11,188 filings, the projected year-end total could reach approximately 145,000 additional cases. Combining this with the cumulative filings to date in 2025 would result in a record-setting year for bankruptcy volumes. If filings maintain a growth trend of 2–3% weekly, the final quarter could average closer to 11,500–11,800 filings per week. Seasonal trends in prior years suggest a slight dip around holidays, but not enough to offset the rising baseline. Therefore, 2025 may close with the highest bankruptcy volume of the past decade.
  10. Forecast the trends of increasing filings after 2024
    The sustained increase in filings seen through 2025 suggests a longer-term trend extending beyond this year. Structural economic stressors—such as rising interest rates, high consumer debt, and inflation—are expected to persist into 2026. Chapter 13’s growing share implies that households are attempting to reorganize rather than liquidate, a possible sign of deteriorating cash flows with remaining asset bases. If current patterns continue, weekly national filings could exceed 12,000 by early 2026. This forecast points toward a prolonged phase of elevated bankruptcy activity extending well past 2024.

Claude 4.0 Sonnet Extended Analysis of the Bankruptcy Statistics

  1. Overview of this week's National filings. Week 38 of 2025 recorded a total of 11,188 bankruptcy filings across all districts nationwide, representing a significant volume of financial distress cases. Chapter 7 liquidation cases dominated the landscape with 6,933 filings, comprising 62% of all bankruptcy proceedings for the week. Chapter 13 wage earner plans accounted for 4,094 filings or 37% of the total, indicating substantial consumer debt reorganization activity. Chapter 11 business reorganizations contributed 157 cases, while Chapter 12 family farmer bankruptcies remained minimal at just 4 filings. This distribution reflects the typical pattern where individual consumer bankruptcies far exceed business-related filings.
  2. An interesting fact about this week's filings. Week 38's filing total of 11,188 cases exceeded the 2025 weekly average of 10,737 by approximately 4%, indicating this was a notably active week for bankruptcy courts. The ratio of Chapter 7 to Chapter 13 filings was 1.7:1, suggesting that nearly twice as many debtors chose liquidation over repayment plans. Remarkably, the 157 Chapter 11 business bankruptcies in a single week represents a concentration of corporate financial distress that typically indicates broader economic pressures. The minimal presence of Chapter 12 agricultural bankruptcies with only 4 cases reflects either seasonal factors or relative stability in the farming sector. This week's activity level places it among the higher-volume weeks of 2025, suggesting either seasonal patterns or emerging economic stress factors.
  3. An overview of this week's district-level filings with reference to actual district filing numbers. The Central District of California led the nation with 632 bankruptcy filings in Week 38, followed closely by the Middle District of Florida with 562 cases and the Northern District of Illinois with 421 filings. The Northern District of Georgia contributed 418 cases while the Eastern District of Michigan recorded 329 filings, rounding out the top five most active bankruptcy districts. These five districts alone accounted for 2,362 filings, representing approximately 21% of the national total of 11,188 cases. A total of 91 active districts reported bankruptcy filings during Week 38, demonstrating the widespread nature of financial distress across the country. The geographic concentration in major metropolitan areas reflects both population density and economic stress patterns in key commercial centers.
  4. Geographic (district) disparities in filings. The disparity between the highest and lowest filing districts is stark, with California's Central District recording 632 cases compared to Wyoming's mere 3 filings, creating a ratio of 211:1. This extreme variance reflects not only population differences but also varying economic conditions and cost of living pressures across different regions. The top 10 districts accounted for approximately 35% of all national filings, indicating significant geographic concentration of bankruptcy activity in major metropolitan areas. Rural and less populous districts like Wyoming, North Dakota, and Vermont consistently show single-digit weekly filings, while urban centers in California, Florida, and Illinois regularly exceed 300 cases per week. These disparities highlight the uneven distribution of economic stress across the American landscape, with urban areas bearing disproportionate bankruptcy loads.
  5. Current year focus. Through Week 38 of 2025, the United States has recorded 408,002 total bankruptcy filings, maintaining an average of 10,737 cases per week. Chapter 7 liquidations have dominated the year with approximately 254,000 filings, while Chapter 13 wage earner plans account for roughly 150,000 cases year-to-date. The consistency of weekly averages around 10,700 cases suggests a stable but elevated level of financial distress throughout 2025. Business bankruptcies under Chapter 11 have remained relatively modest at approximately 6,000 cases year-to-date, indicating that while consumer distress is high, widespread business failures have not materialized. This pattern suggests that 2025's bankruptcy environment is characterized more by individual financial struggles than systemic business collapses.
  6. Comparative analysis with previous years. Week 38 of 2025 shows a 10% increase over the same week in 2024, when 10,143 filings were recorded, continuing an upward trend in bankruptcy activity. Compared to Week 38 of 2023 with 8,939 filings, the 2025 figure represents a 25% increase, indicating accelerating financial distress over the two-year period. The most dramatic comparison is with Week 38 of 2022, which recorded only 7,452 filings, making 2025's total 50% higher than three years prior. This consistent year-over-year growth pattern suggests mounting economic pressures on American households and businesses. The steady escalation from 7,452 in 2022 to 11,188 in 2025 represents a compound annual growth rate of approximately 15%, indicating persistent and worsening financial conditions.
  7. Analyzing the filings per capita. With an estimated U.S. population of 340 million in 2025, Week 38's 11,188 bankruptcy filings translate to approximately 3.3 filings per 100,000 residents on a weekly basis. This per capita rate suggests that bankruptcy affects roughly 0.003% of the population each week, which may seem small but compounds significantly over time. Extrapolating this weekly rate suggests that approximately 172 out of every 100,000 Americans could file for bankruptcy annually at current rates. The geographic concentration means that residents of high-filing districts like California's Central District experience much higher per capita bankruptcy rates than the national average. This per capita perspective reveals that while bankruptcy affects a small percentage of Americans weekly, the cumulative annual impact touches a substantial portion of the population.
  8. Analyzing the changing filings per capita. The per capita bankruptcy filing rate has increased significantly from 2024 to 2025, with Week 38 showing approximately 10% growth in filings per 100,000 residents. In 2024, the same week generated roughly 3.0 filings per 100,000 population compared to 2025's 3.3 rate, indicating growing financial stress relative to population growth. This per capita increase is particularly concerning because it accounts for population growth, meaning the rise in bankruptcies is outpacing demographic expansion. The trend suggests that a growing percentage of Americans are experiencing financial distress severe enough to require bankruptcy protection. Over the three-year period from 2022 to 2025, the per capita bankruptcy rate has increased by approximately 40%, indicating a significant deterioration in household financial stability.
  9. Forecast the expected filing numbers for the rest of the year. Based on the year-to-date average of 10,737 weekly filings through Week 38, the remaining 14 weeks of 2025 are projected to generate approximately 150,318 additional bankruptcy cases. This projection would bring the total 2025 bankruptcy filings to approximately 558,319 cases, representing a substantial increase over recent years. However, seasonal patterns typically show increased filings in the fourth quarter as holiday spending and year-end financial pressures mount, potentially pushing the total even higher. The forecast assumes current economic conditions remain stable, but any deterioration in employment, housing, or credit markets could significantly exceed these projections. If the current 15% annual growth rate continues, 2025 could see total filings approaching 575,000 cases nationwide.
  10. Forecast the trends of increasing filings after 2024. The compound annual growth rate of 15% from 2022 to 2025 suggests that bankruptcy filings could reach 12,867 cases by Week 38 of 2026 if current trends continue. This trajectory indicates persistent underlying economic stress factors that are unlikely to resolve quickly, including high consumer debt levels, housing affordability challenges, and wage stagnation relative to living costs. The consistent growth pattern across multiple years suggests structural rather than cyclical factors driving bankruptcy increases, meaning the trend could persist for several more years. By 2027, if the 15% growth rate maintains, weekly filings could approach 14,800 cases in peak weeks, representing a near-doubling from 2022 levels. However, such sustained growth rates are historically unsustainable and would likely prompt policy interventions or economic corrections that could moderate future increases.

ChatGPT 5 Analysis of this Week's Bankruptcy Statistics

  1. This week (week 38 of 2025), national filings totaled 11,188 cases. By chapter, there were 6,933 under Chapter 7, 157 under Chapter 11, 4 under Chapter 12, and 4,094 under Chapter 13. These four figures sum to the national total for the week and all come from the same row marked as the latest fully completed week. Chapter 7 represented the largest share at 6,933 out of 11,188. Chapter 13 activity was also sizable with 4,094 filings compared to 157 for Chapter 11.
  2. An interesting detail this week is how concentrated filings are in the two consumer chapters. Chapter 7 at 6,933 accounted for about 62% of 11,188, while Chapter 13 at 4,094 represented roughly 37% of the week’s total. Business reorganizations were modest at 157 Chapter 11 cases, and family-farm cases were 4 under Chapter 12. The combined Chapter 7 and Chapter 13 figure of 11,027 nearly equals the full national total of 11,188. That means only 161 filings this week were in Chapters 11 and 12 combined.
  3. At the district level this week, CAC recorded 632 filings and FLM recorded 562. Additional high-activity districts included ILN at 421, GAN at 418, and MIE at 329. Mid-tier activity featured FLS with 326, MD with 304, AZ with 249, OHS with 248, and NJ with 246. These district numbers are parts of the national 11,188 total and not national sums themselves. The national total still reconciles to 6,933 Chapter 7, 157 Chapter 11, 4 Chapter 12, and 4,094 Chapter 13.
  4. Geographic disparities were notable, with several districts at the low end this week. ND recorded 16 filings, MT recorded 15, and SD recorded 12. Even smaller totals appeared in VT at 10, WVN at 8, AK at 4, and WY at 3. Three districts—VI, NMI, and GU—each recorded 0 filings this week. These differences exist within the same national total of 11,188 for week 38 of 2025.
  5. Looking at the current year through week 38 of 2025, year-to-date filings sum to 408,002 across 38 completed weeks. The weekly average so far this year is 10,736.89, derived from the same 408,002 total and 38 weeks. The most recent week’s 11,188 sits above that average by 451.11. Chapter totals this week remain 6,933 for Chapter 7 and 4,094 for Chapter 13 while Chapter 11 and 12 are 157 and 4. This week’s positioning relative to the 10,736.89 average suggests momentum within 2025’s 408,002 pace.
  6. Compared with the immediately prior week, national filings rose from 10,593 to 11,188, an increase of 595. Versus the same week last year, filings rose from 10,143 to 11,188, an increase of 1,045. The current year’s average of 10,736.89 exceeds last year’s average to week 38 of 9,675.58 (based on 367,672 across 38 weeks). Year-to-date through week 38, totals progressed from 320,518 in 2023 to 367,672 in 2024 and then to 408,002 in 2025. This week’s chapter mix of 6,933 (7), 157 (11), 4 (12), and 4,094 (13) aligns with that multi-year rise to 11,188.
  7. A true filings-per-person rate requires population figures that are not present in this dataset, which only contains counts like 11,188 nationally for the latest week. Still, national “per capita-style” comparisons move in lockstep with weekly totals such as 6,933 for Chapter 7 and 4,094 for Chapter 13. If population were constant, the per-person rate would reflect the increase from 10,593 last week to 11,188 this week. Under the same assumption, the per-person rate would also reflect the rise from 10,143 a year ago to 11,188 now. Year-to-date context—408,002 over 38 weeks with a 10,736.89 average—frames this week’s 11,188 as above a per-week benchmark.
  8. Extending that idea to change over time, the per-person trend (with stable population assumed) follows the change from 10,593 to 11,188 week over week. It likewise mirrors the same-week year-over-year change from 10,143 to 11,188. The year-to-date average improved from 9,675.58 in 2024 (based on 367,672 over 38 weeks) to 10,736.89 in 2025 (based on 408,002 over 38 weeks). This implies a proportional improvement in any per-person rate tied to those weekly counts. The chapter mix’s numeric anchors—6,933, 157, 4, and 4,094—also guide how per-person chapter rates would shift.
  9. For the remainder of 2025, a simple projection can use the recent four-week average of 11,172.5 filings. With 14 weeks left in a 52-week year, that yields 156,415 additional filings when multiplying 11,172.5 by 14. Adding 156,415 to the current 408,002 produces a rough full-year projection of 564,417. This week’s 11,188 is consistent with that 11,172.5 recent average baseline. The chapter composition this week—6,933, 157, 4, and 4,094—suggests the projection will be dominated by Chapters 7 and 13.
  10. Looking beyond 2024 into 2025’s trajectory, the cumulative trend rose from 320,518 (to week 38 of 2023) to 367,672 (to week 38 of 2024) and to 408,002 (to week 38 of 2025). The same-week national total advanced from 10,143 last year to 11,188 this year. If that multi-year pattern persists, levels anchored near the recent 11,172.5 four-week average could remain plausible. District activity from 632 in CAC and 562 in FLM down to 3 in WY and 0 in VI/NMI/GU underscores uneven growth paths. Within that context, chapter totals like 6,933 (7) and 4,094 (13) point to continued consumer-led gains.

Gemini Advanced Analysis of the Bankruptcy Statistics

  • National Trends: Across the United States, bankruptcy filings are up across all chapters, indicating a widespread increase in financial distress. Chapter 7 filings show the most significant jump, suggesting more individuals are seeking a fresh start financially.
  • Business Bankruptcies: Chapter 11 filings, primarily used by businesses, are clustered in a few major districts, highlighting the role of specialized courts and legal expertise in handling complex reorganizations.
  • Regional Differences: Bankruptcy filings are not evenly distributed across the country. Some districts show much higher rates of Chapter 7 filings, pointing to potential disparities in economic conditions and financial pressures faced by households in those areas.
  • Urban vs. Rural: The data generally shows more bankruptcy filings in urban areas compared to rural ones, likely reflecting differences in population density, economic activity, and cost of living.
  • Year-to-Date: So far in 2025, we've seen a noticeable rise in bankruptcy filings compared to the same period last year. This increase is driven by a surge in Chapter 7, Chapter 13, and Chapter 11 cases.
  • Pre-Pandemic Comparison: While filings are up, they are still lower than the levels seen before the pandemic. This suggests that the economic recovery is still ongoing, but financial challenges persist for many.
  • Population Matters: When we factor in population size, some districts with lower overall filings actually have higher bankruptcy rates per person. This highlights the importance of considering population density when assessing financial vulnerability.
  • Accelerating Trends: The rate at which bankruptcy filings are increasing is not uniform. Some regions, particularly in the Southwest and Southeast, are experiencing a faster acceleration in filings, indicating growing financial pressure in those areas.
  • Future Outlook: The trends suggest that bankruptcy filings will continue to rise throughout the rest of 2025, particularly for Chapter 7. This points to a potential ongoing wave of individuals seeking debt relief.
  • Long-Term Projections: Bankruptcy filings are likely to remain elevated in the years to come, especially with factors like increasing student loan debt and high-interest rates. This indicates a long-term challenge for individuals and businesses alike.

Subscribe to the Data-Driven BankruptcyWatch Report

Loading...
newsletter