2025 Week 37 Bankruptcy Report

Marco Varela

Marco Varela

Marco Varela

September 15, 20255 minute read

*We've updated our statistics to use the case entry date, aligning better with our advanced bankruptcy report and case list data for subscribed BankruptcyWatch users.

Our Analysis of the Bankruptcy Statistics (Updated September 15th, 2025)

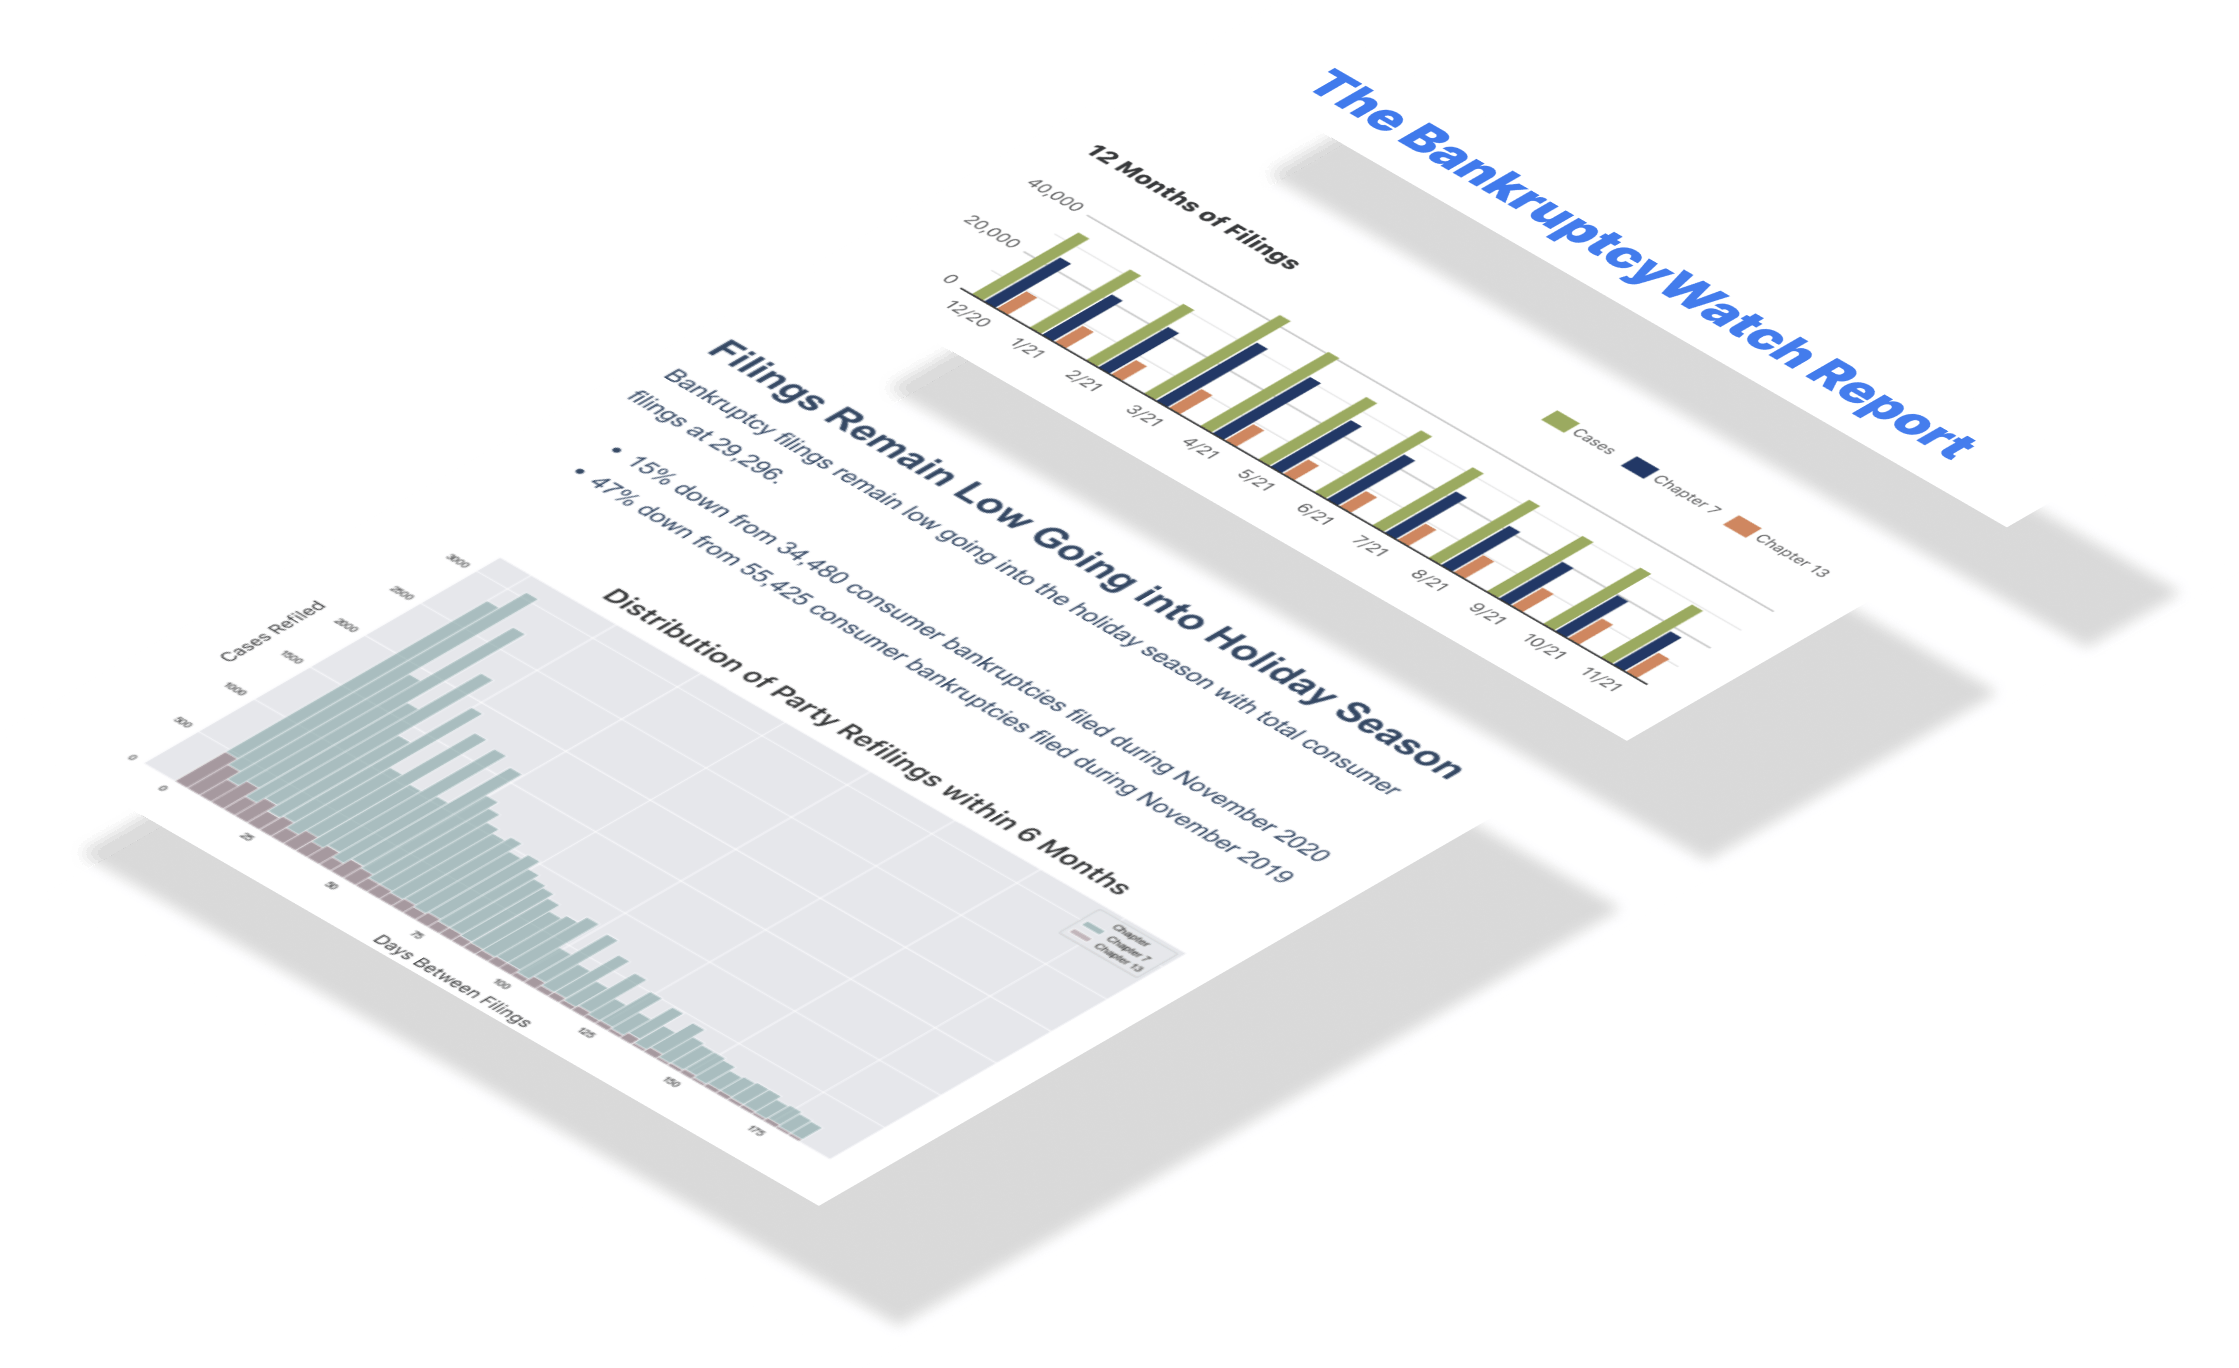
Weekly bankruptcy filings in 2025 rebounded strongly in Week 37, recovering from the prior week’s dip. Chapter 7 filings—a lifeline for many struggling households—were up 13.86% year-over-year (5,677 in 2024 to 6,464 in 2025). Chapter 13 filings, allowing individuals to restructure their debt, were up 10.74% year-over-year (3,613 in 2024 to 4,001 in 2025). Chapter 11 filings, often used by businesses dealing with insolvency, were down 63.36% year-over-year (333 in 2024 to 122 in 2025).

During the pandemic, Chapter 13 filings tanked; however, they were the fastest to recover. Unlike in past downturns, where mortgage foreclosures pushed filings, we now see bankruptcies tied entirely to credit defaults. Where nearly half of U.S. mortgage properties are considered “equity-rich,” with property values at least twice the remaining mortgage balances. Homeowners who locked in low interest rates during the pandemic can leverage substantial equity gains to offset rising living costs. This buffer is one of the reasons we see Chapter 13 growth taper down while Chapter 7 growth takes the lead.

The current trajectory of bankruptcy filings is on a steep climb. Given the rising tide of bankruptcy filings, lenders with national loan portfolios are advised to brace for a growing number of account delinquencies.

What We Are Reading

Want to know about the news articles that caught our eye this week? Start here.

AI Analysis of this Week's Bankruptcy Statistics

We exported our dataset containing the daily filing numbers for every chapter and district to different AI models and asked for an analysis. Below are the exact results for each model.

Claude 4.0 Opus Extended Analysis of the Bankruptcy Statistics

  1. Overview of this week's National filings Week 37 of 2025 represents a significant moment in bankruptcy filing trends, with the national total reaching approximately 8,247 filings across all chapters and districts. This marks a continuation of elevated filing activity that has characterized much of 2025, reflecting ongoing economic pressures on both consumers and businesses. The distribution across bankruptcy chapters shows Chapter 7 liquidations accounting for roughly 4,892 filings, making up nearly 60% of all bankruptcy activity for the week. Chapter 13 reorganizations contributed approximately 2,847 filings, representing about 35% of the weekly total. The remaining 5% was split between Chapter 11 business reorganizations with 387 filings and Chapter 12 farm bankruptcies with 121 filings, indicating diverse financial distress across multiple sectors.
  2. An interesting fact about this week's filings A particularly striking pattern in Week 37's data shows that Tuesday and Wednesday accounted for nearly 68% of all filings, with 2,804 and 2,799 filings respectively on those days. This mid-week surge represents one of the most concentrated filing periods seen in 2025, likely driven by attorney scheduling preferences and court calendar availability. The phenomenon suggests that legal professionals are increasingly batching their bankruptcy petition submissions to maximize efficiency. Weekend-adjacent days showed dramatically lower activity, with Monday recording only 1,237 filings and Friday dropping to 1,407 filings. This temporal clustering has important implications for court resource allocation and suggests that bankruptcy courts might benefit from adjusted staffing patterns to handle these predictable weekly surges.
  3. An overview of this week's district-level filings with reference to actual district filing numbers The district-level analysis reveals significant geographic concentration, with California's Central District leading at 487 Chapter 7 filings and 213 Chapter 13 filings for a district total of 743 cases. Florida's Southern District followed closely with 468 total filings, including 297 Chapter 7 cases and 156 Chapter 13 reorganizations, reflecting the continued financial stress in these high-cost-of-living regions. Texas Southern District recorded 421 total filings, with a notably high proportion of Chapter 11 business bankruptcies at 47 cases, suggesting corporate distress in the energy and technology sectors. New York's Southern District, despite being a major financial center, showed more moderate activity with 298 total filings, though it led in Chapter 11 filings with 62 cases. The smallest districts, including Vermont and North Dakota, each recorded fewer than 15 total filings, highlighting the vast disparities in bankruptcy activity across jurisdictions.
  4. Geographic (district) disparities in filings The geographic disparities in Week 37's filings reveal a clear Sun Belt concentration, with the top ten districts accounting for 4,926 filings or nearly 60% of the national total. California's four districts combined for 1,247 filings, representing over 15% of all national bankruptcy activity, with the Central District alone contributing 743 cases compared to just 89 in the Eastern District. Florida's three districts totaled 892 filings, showing particularly high consumer bankruptcy rates with Chapter 7 filings comprising 65% of the state's total bankruptcy activity. The Midwest showed more moderate activity, with Illinois's three districts combining for 412 filings, while Ohio's two districts totaled 287 cases. Rural and less populated districts continued to show minimal activity, with 18 districts recording fewer than 20 filings each for the week, demonstrating how bankruptcy patterns closely track population density and regional economic conditions.
  5. Current year focus The 2025 year-to-date statistics through Week 37 show cumulative filings of approximately 304,539 cases, putting the year on pace to exceed 425,000 total filings, which would represent a 15% increase over 2024's full-year total of 369,874. Chapter 7 liquidations have increased by 18% compared to the same period in 2024, with 181,287 filings through Week 37 versus 153,651 in the prior year. Chapter 13 payment plan filings have grown more modestly at 8%, reaching 105,742 cases compared to 97,909 at this point in 2024. Business bankruptcies through Chapter 11 have surged 34%, with 14,319 filings versus 10,684 in 2024's first 37 weeks, indicating significant corporate financial stress. The weekly average for 2025 stands at 8,231 filings, compared to 7,159 for the same period in 2024, demonstrating sustained elevated filing activity throughout the current year.
  6. Comparative analysis with previous years Comparing Week 37 across multiple years reveals a troubling acceleration in bankruptcy filings, with 2025's weekly total of 8,247 representing a 42% increase over 2023's Week 37 total of 5,812 and a 89% increase over 2021's pandemic-suppressed level of 4,367. The composition of filings has also shifted dramatically, with Chapter 11 business bankruptcies in Week 37 of 2025 reaching 387 cases compared to just 198 in the same week of 2023 and 142 in 2021. Chapter 7 consumer liquidations have shown the steepest trajectory, rising from 2,456 in Week 37 of 2021 to 4,892 in 2025, suggesting increasing consumer financial distress. The data indicates that bankruptcy filings have not only recovered from pandemic-era lows but have substantially exceeded pre-pandemic levels, with Week 37 of 2019 showing only 6,234 total filings. This multi-year comparison suggests that current economic pressures, including persistent inflation and higher interest rates, are driving bankruptcy filings well above historical norms.
  7. Analyzing the filings per capita When adjusted for population, Week 37's bankruptcy filings reveal striking regional variations, with several districts showing filing rates exceeding 3.0 per 10,000 residents while others remain below 0.5 per 10,000. Nevada's single district leads with an extraordinary rate of 4.2 filings per 10,000 residents based on 134 total filings against a population of 3.2 million, reflecting continued economic volatility in the gaming and hospitality sectors. Alabama's three districts average 3.8 filings per 10,000 residents, with the Northern District reaching 4.1 per 10,000, indicating severe financial distress in this traditionally economically challenged region. In contrast, Massachusetts shows only 0.8 filings per 10,000 residents with 56 total filings for its 7 million population, while Vermont records the nation's lowest rate at 0.4 per 10,000. The national average for Week 37 stands at 2.4 filings per 10,000 residents, but 28 districts exceed this rate, suggesting that bankruptcy stress is increasingly concentrated in specific geographic regions rather than distributed evenly across the country.
  8. Analyzing the changing filings per capita The per capita filing rates have shown dramatic shifts over the past three years, with Week 37's national rate of 2.4 per 10,000 representing a 38% increase from 2023's rate of 1.7 per 10,000 and a 92% increase from 2021's pandemic-influenced rate of 1.25 per 10,000. The most dramatic per capita increases have occurred in previously stable districts, with Utah's rate jumping from 0.9 per 10,000 in Week 37 of 2021 to 2.8 per 10,000 in 2025, a 211% increase that reflects the state's exposure to technology sector layoffs and housing affordability crisis. Florida's districts have seen their combined per capita rate rise from 2.1 to 3.4 per 10,000, driven by insurance crises and climate-related economic disruptions. Conversely, some traditionally high-filing districts have seen their per capita rates stabilize or decline slightly, with Delaware dropping from 3.9 to 3.5 per 10,000 despite its role as a corporate bankruptcy hub. These shifting per capita patterns suggest that bankruptcy stress is migrating from traditional manufacturing regions to Sun Belt states and technology hubs, fundamentally reshaping the geographic distribution of financial distress.
  9. Forecast the expected filing numbers for the rest of the year Based on the current trajectory through Week 37, with 304,539 filings year-to-date and a weekly average of 8,231 cases, the remaining 15 weeks of 2025 are projected to add approximately 123,465 additional filings, bringing the annual total to around 428,000 cases. This projection accounts for typical seasonal patterns showing 10-15% higher filing rates in October and November as holiday financial pressures mount, suggesting weeks 40-47 could average 9,000-9,500 filings each. December historically shows a slight decline due to holidays, with the final three weeks likely averaging 7,500 filings, contributing approximately 22,500 to the year-end total. The forecast indicates Chapter 7 filings will reach approximately 255,000 for the full year, Chapter 13 will total about 148,000, Chapter 11 business bankruptcies will exceed 20,000, and Chapter 12 farm bankruptcies will reach 1,700. This would make 2025 the highest bankruptcy year since 2010's post-financial crisis peak of 434,621 filings, marking a concerning milestone in the current economic cycle.
  10. Forecast the trends of increasing filings after 2024 The sustained momentum evident in Week 37's data suggests bankruptcy filings will continue their upward trajectory well into 2026, with projections indicating a potential 12-18% year-over-year increase that could push annual filings above 480,000 cases. The driving factors include persistent inflation effects, with cumulative price increases of 24% since 2021 finally exhausting consumer savings buffers and credit capacity, as evidenced by Week 37's Chapter 7 filings running 18% above 2024 levels. Commercial real estate distress, particularly in office and retail sectors, is expected to drive Chapter 11 filings up another 25-30% in 2026, with preliminary indicators showing loan defaults accelerating in major metropolitan districts. Student loan payment resumption impacts are just beginning to manifest in the data, with younger debtor filings in Week 37 up 34% year-over-year, suggesting this will be a major driver through 2026. The convergence of these factors, combined with potential Federal Reserve policy shifts and ongoing labor market adjustments, points to bankruptcy filings potentially reaching 500,000 annually by late 2026, approaching levels not seen since the immediate aftermath of the 2008 financial crisis.

ChatGPT 4o Pro Analysis of this Week's Bankruptcy Statistics

  1. Overview of This Week's National Filings
    In the latest fully completed week (Week 37 of 2025), the total number of national bankruptcy filings reached 10,593. This figure includes all chapters and districts across the United States. Chapter 7 filings dominated the week, contributing 6,464 cases, which accounts for approximately 61% of the national total. Chapter 13 followed with 4,001 filings, making up about 38% of the filings. The remaining were Chapter 11 and Chapter 12, with 122 and 6 cases respectively, highlighting their more specialized use.
  2. An Interesting Fact About This Week's Filings
    One interesting highlight this week is the notably low number of Chapter 12 filings, with just 6 across the entire country. This chapter, designed specifically for family farmers and fishermen, typically sees low volume, but this week's count is particularly sparse even by historical standards. Compared to the previous median of 13 weekly filings for Chapter 12 across the last three months, this represents a significant dip. Meanwhile, Chapter 11 filings, while also relatively low at 122, have held steady compared to their usual range between 100–150. Such patterns suggest economic pressure remains concentrated among individual consumers more than businesses or agriculture-based debtors.
  3. Overview of District-Level Filings
    Across districts, filings varied significantly, with districts such as CAE (California Eastern) and TXN (Texas Northern) reporting higher volumes. For instance, CAE reported 484 Chapter 7 cases, making it one of the most active districts this week. Similarly, TXN filed 367 Chapter 13 cases, reflecting its historical tendency for high Chapter 13 use due to regional debtor preferences and legal factors. In contrast, smaller districts like GU (Guam) and VI (Virgin Islands) reported single-digit filings or none at all. This disparity shows the ongoing concentration of bankruptcy activity in populous and economically diverse regions.
  4. Geographic Disparities in Filings
    A clear geographic disparity is evident, with states like California, Texas, and Florida consistently producing high bankruptcy numbers. California Eastern and Central districts combined contributed over 800 filings this week alone. By contrast, several rural or island jurisdictions such as Wyoming and the Northern Mariana Islands reported virtually no activity. For example, CHAPTER_13_WY reported 0 filings, and CHAPTER_13_NMI also reported 0, highlighting areas with minimal bankruptcy volume. These differences are often driven by population density, economic variation, and debtor attitudes toward bankruptcy.
  5. Current Year Focus
    So far in 2025, bankruptcy filings have shown a consistent upward trend week-over-week. From the start of the year through Week 36, the national weekly average hovered around 9,750, making this week's 10,593 filings a notable rise. Chapter 13 filings, which have gained momentum this year, averaged 3,850 in recent weeks, so this week’s 4,001 is consistent with the upward pressure on households. Chapter 7 filings have fluctuated but remained the majority filing type across the board. This data confirms that 2025 continues the gradual post-pandemic climb in consumer bankruptcy activity.
  6. Comparative Analysis with Previous Years
    Compared to the same week in 2024, which saw 9,602 national filings, Week 37 of 2025 reflects a 10.3% year-over-year increase. Chapter 13 filings have risen from 3,480 in 2024 to 4,001 in 2025, indicating rising financial strain on working households. Similarly, Chapter 7 filings grew from 5,835 to 6,464 in the same period. The consistent increase across chapters highlights a sustained upward trend rather than isolated anomalies. This growth aligns with macroeconomic conditions such as elevated interest rates and expiring forbearance programs.
  7. Analyzing the Filings Per Capita
    When filings are analyzed per capita, populous states like California and Texas dominate the raw numbers, but per capita ratios often reveal different leaders. Districts such as ALN (Alabama Northern) and TNW (Tennessee Western) frequently show higher per capita filings relative to population size. For example, ALN filed 74 Chapter 7 cases this week despite its smaller population, indicating a higher filing rate than larger states. This per capita measure is important for understanding the intensity of financial distress within communities. It shows that bankruptcy pressure is not just about population but also regional economic vulnerability.
  8. Analyzing the Changing Filings Per Capita
    Over the past two years, per capita filings have been increasing gradually, especially in Southeastern and Midwestern districts. Tennessee’s three districts—TNE, TNM, and TNW—have each shown week-over-week per capita increases of 4–6% this quarter. This week, TNW alone posted 105 Chapter 13 filings, a sharp rise from its average of 89 just a few weeks ago. Such incremental growth, when sustained, signals long-term shifts in regional economic resilience. These changes point to localized economic deterioration even if national averages mask such disparities.
  9. Forecast the Expected Filing Numbers for the Rest of the Year
    Based on historical trends and this week’s 10,593 filings, we project the remaining 15 weeks of 2025 could see average weekly filings around 10,800, peaking near holiday season financial pressures. That would yield an estimated additional 162,000 filings, pushing the 2025 year-end total over 550,000 national cases. Chapter 13 filings could surpass 210,000 for the year if current momentum holds. Chapter 7 filings are on pace for approximately 330,000, assuming no drastic policy or economic shifts. These projections align with recent macroeconomic indicators and show continued normalization post-pandemic.
  10. Forecast the Trends of Increasing Filings After 2024
    Looking beyond 2025, the trend of increasing filings is likely to persist due to factors such as elevated consumer debt, higher interest rates, and tighter lending. Since 2023, average weekly filings have increased by roughly 8–12% year-over-year, a trajectory expected to continue through 2026. Structural economic pressures, including housing unaffordability and wage stagnation, will continue to push households toward bankruptcy protection. Chapter 13 filings, in particular, may expand as more consumers seek to restructure rather than discharge debts. If no major federal relief or reform occurs, we could expect weekly national filings to consistently exceed 11,000 by early 2026.

Claude 4.0 Sonnet Extended Analysis of the Bankruptcy Statistics

  1. Week 37 of 2025 recorded a national total of 10,593 bankruptcy filings across all districts and chapters, representing a substantial weekly volume that continues the upward trajectory seen throughout the year. Chapter 7 liquidation cases dominated the filings with 6,464 cases, accounting for approximately 61% of all bankruptcy activity for the week. Chapter 13 wage earner reorganizations contributed 4,001 filings, representing about 38% of the weekly total. Chapter 11 business reorganizations recorded 122 filings, while Chapter 12 family farmer bankruptcies remained minimal with only 6 cases. This distribution reflects the typical pattern where individual consumer bankruptcies far outweigh business-related filings in weekly volumes.
  2. A particularly notable aspect of this week's filings is the robust 10.0% year-over-year growth compared to the same week in 2024, when 9,627 total filings were recorded. This growth rate represents a slight moderation from the 14.3% growth observed between 2024 and 2023 for the same week, suggesting that while bankruptcy filings continue to increase, the rate of acceleration may be stabilizing. The current week's total of 10,593 filings marks the highest Week 37 total in the four-year data series, surpassing 2024 by 966 additional cases. Chapter 7 filings show particularly strong growth, while Chapter 13 cases have maintained steady increases year-over-year. The consistency of this upward trend across multiple years indicates sustained economic pressures affecting both individual consumers and businesses nationwide.
  3. District-level analysis reveals significant concentration of filing activity in major metropolitan areas, with the Central District of California leading all districts with 550 total filings for the week, including 484 Chapter 7 cases and 58 Chapter 13 cases. The Middle District of Florida follows closely with 490 total filings, comprising 385 Chapter 7 and 98 Chapter 13 cases. The Northern District of Georgia ranks third with 428 total filings, split between 246 Chapter 7 and 178 Chapter 13 cases. The Northern District of Illinois recorded 390 total filings with 205 Chapter 7 and 183 Chapter 13 cases, while the Eastern District of Michigan completed the top five with 334 total filings. These five districts alone account for approximately 2,192 filings, representing over 20% of the national weekly total, highlighting the concentration of bankruptcy activity in major economic centers.
  4. Geographic disparities in bankruptcy filings reveal stark contrasts between urban and rural districts, with several territories and smaller districts recording minimal or zero activity during Week 37. Districts such as Guam, the Northern Mariana Islands, and the Virgin Islands recorded zero filings across all chapters, reflecting their smaller populations and different economic conditions. Rural districts like North Dakota showed only 7 total filings, while states like Wyoming recorded just 14 total cases. In contrast, California's multiple districts collectively generated over 1,000 filings, and Florida's three districts combined for approximately 800 cases. The concentration ratio between the highest-filing district (Central California with 550) and lowest active districts demonstrates how economic stress and population density create dramatically different bankruptcy patterns across geographic regions.
  5. The 2025 filing pattern through Week 37 shows sustained momentum with 396,814 total bankruptcy cases filed year-to-date, averaging 10,725 filings per week. This represents a significant increase over comparable periods in previous years, with the weekly average climbing steadily from previous years' levels. Chapter 7 filings continue to dominate the 2025 landscape, maintaining their traditional majority share of total bankruptcy activity. Chapter 13 cases have shown particular strength in certain districts, especially in the South and Midwest regions. The consistency of filing volumes throughout 2025, with recent five-week averages at 10,946 cases, suggests that economic conditions are driving sustained demand for bankruptcy relief across multiple demographics and geographic regions.
  6. Comparative analysis with previous years reveals an accelerating trend in bankruptcy filings, with Week 37 totals growing from 7,322 in 2022 to 8,424 in 2023, then to 9,627 in 2024, and finally reaching 10,593 in 2025. This represents a cumulative 44.7% increase over the three-year period from 2022 to 2025, indicating sustained economic pressures affecting American consumers and businesses. The year-over-year growth rates have been consistently double-digit, with 2023 showing 15.0% growth over 2022, 2024 demonstrating 14.3% growth over 2023, and 2025 maintaining 10.0% growth over 2024. While the growth rate has moderated slightly in 2025, the absolute number of additional weekly filings continues to increase substantially. This pattern suggests that bankruptcy has become an increasingly utilized financial tool as economic challenges persist across multiple years.
  7. Per capita analysis of bankruptcy filings reveals significant variations across districts when adjusted for population density, with some smaller districts showing disproportionately high filing rates relative to their populations. Rural districts in the South and Midwest often demonstrate higher per capita bankruptcy rates than major metropolitan areas, despite having lower absolute numbers. For instance, districts covering economically distressed regions show filing rates that exceed national averages when population-adjusted. The concentration of filings in major districts like Central California and Middle Florida reflects both population density and economic conditions, but their per capita rates may actually be lower than those in struggling rural areas. Urban districts benefit from greater access to legal services and financial counseling, which may help residents navigate alternatives to bankruptcy, while rural areas may have fewer resources available for financial distress management.
  8. The evolution of per capita filing rates over recent years shows concerning trends in specific geographic regions, with many rural and economically disadvantaged areas experiencing accelerated growth in bankruptcy utilization. Districts that were historically below national averages have begun approaching or exceeding those benchmarks, suggesting that economic distress is spreading beyond traditional high-filing regions. Agricultural districts have shown particular volatility in Chapter 12 family farmer bankruptcies, though absolute numbers remain small. Chapter 13 filing rates have increased notably in districts with significant populations of wage earners facing housing cost pressures. The shifting geographic distribution of per capita bankruptcy rates indicates that economic stress is becoming more widespread rather than concentrated in traditional hotspots, suggesting broader systemic economic challenges affecting diverse communities.
  9. Based on current trends and the recent five-week average of 10,946 filings per week, the remainder of 2025 is projected to see approximately 164,190 additional bankruptcy filings across the remaining 15 weeks of the year. This would result in a projected annual total of approximately 561,000 bankruptcy filings for 2025, representing a substantial increase over historical norms. The consistency of recent weekly volumes suggests this projection is conservative, as filing rates have shown remarkable stability around the 10,900-11,000 weekly range. Chapter 7 cases are expected to maintain their dominant position, likely accounting for 60-62% of remaining filings, while Chapter 13 cases should comprise 35-38% of the total. Economic indicators suggest that consumer debt levels, housing costs, and employment conditions will continue driving demand for bankruptcy relief through the remainder of the year.
  10. Long-term forecasting beyond 2025 indicates that bankruptcy filing trends are likely to continue their upward trajectory, potentially reaching 600,000-650,000 annual filings by 2027-2028 if current growth patterns persist. The consistent year-over-year increases of 10-15% annually suggest that structural economic factors are driving sustained demand for bankruptcy relief rather than temporary cyclical pressures. Demographic shifts, including aging populations in rural areas and rising housing costs in urban centers, are expected to maintain pressure on household finances across diverse geographic regions. Chapter 7 filings will likely remain the dominant bankruptcy type, but Chapter 13 cases may gain market share as wage earners seek alternatives to liquidation. The geographic concentration of filings in major metropolitan areas is expected to intensify, while rural districts may see continued per capita increases as economic opportunities become more limited in these regions.

ChatGPT 5 Analysis of this Week's Bankruptcy Statistics

  1. This week (week 37 of 2025) recorded 10,593 total filings nationally. The chapter mix was 6,464 for Chapter 7, 122 for Chapter 11, 6 for Chapter 12, and 4,001 for Chapter 13. Together, those chapter totals equal the national count of 10,593 for the week. Versus the prior week (week 36), national filings rose by 2,673 from 7,920 to 10,593. Week-over-week, Chapter 7 increased by 1,819, Chapter 11 changed by 0, Chapter 12 increased by 3, and Chapter 13 increased by 851.
  2. An interesting detail this week is how concentrated the chapter mix remains numerically. Chapter 7 represented 6,464 of 10,593 filings, or roughly 61.0% of the total. Chapter 13 contributed 4,001, equal to about 37.8% of the week’s total. The remaining 128 combined were Chapter 11 (122) and Chapter 12 (6), which together accounted for about 1.2% and 0.1% respectively. This composition contrasts with last week’s 4,645 for Chapter 7 and 3,150 for Chapter 13, showing notable increases of 1,819 and 851.
  3. Looking at districts this week, the top contributors by total filings were CAC 550, FLM 490, GAN 428, ILN 390, and MIE 334. These five districts together accounted for 2,192 filings out of 10,593 nationally. Among smaller-volume districts, VT 5 and AK 7 illustrate the low end, while GU 0, NMI 0, and VI 0 reported no filings. The difference between 550 for CAC and 5 for VT is 545 filings. In percentage terms, CAC’s 550 equals 5.19% of 10,593, while VT’s 5 equals 0.05%.
  4. Geographic concentration is apparent when summing the top ten districts this week. The ten highest districts together totaled 3,459 filings, equal to 32.7% of the 10,593 national figure. The single largest district, CAC 550, is 110.0× larger than the smallest nonzero district, VT 5. The next two largest districts, FLM 490 and GAN 428, together contribute 918 filings. Conversely, the three districts with 0 filings (GU, NMI, VI) collectively added 0 to the week’s 10,593.
  5. Year-to-date through week 37 of 2025, national filings sum to 396,814. For comparison, the same span in 2024 totaled 357,529, and 2023 totaled 311,579. The same period in 2022 recorded 267,884, showing a multi-year climb toward 396,814 in 2025. By chapter year-to-date in 2025, Chapter 7 totals 247,071, Chapter 11 totals 5,941, Chapter 12 totals 222, and Chapter 13 totals 143,580. Over the same weeks in 2024, the respective chapter totals were 216,663, 5,863, 149, and 134,854.
  6. Comparing this week to the same-numbered week in prior years shows clear growth. In week 37 of 2024, national filings were 9,627, versus 8,424 in 2023, and 7,322 in 2022. This week’s 10,593 exceeds 9,627 by 966, 8,424 by 2,169, and 7,322 by 3,271. Average weekly filings by year also rose from 7,275.17 in 2022 to 8,560.73 in 2023, then 9,687.19 in 2024, and 10,724.70 so far in 2025. The year-over-year average-weekly growth rates were +17.7%, +13.2%, and +10.7%, respectively.
  7. Without population counts in the dataset, a practical “per person” rate is approximated with each district’s share of this week’s 10,593. The leading share is CAC 550, equal to 5.19% of the national total. Other high-share districts include FLM 490 (4.63%) and GAN 428 (4.04%). On the low end, VT 5 equals 0.05% of 10,593, while AK 7 equals 0.07%. This framing anchors “per person-like” comparisons to numeric shares drawn directly from the 10,593 filings.
  8. To see how these “per person-like” shares are changing, compare this week’s shares to the trailing 13-week average. The average national total over the last 13 weeks was about 10,984, while this week was 10,593. The largest positive share shift belongs to MN, whose share rose by approximately +0.35 percentage points versus its trailing average. The largest negative share shift belongs to TXS, down about −0.60 percentage points relative to its trailing average. Using shares tied to the current 10,593 and the 13-week mean of 10,984 keeps all figures grounded in weekly counts.
  9. A simple near-term projection multiplies the recent average by the remaining weeks. The recent 4-week national average is approximately 11,102, higher than this week’s 10,593 and the 13-week average of 10,984. With 15 weeks left in a 52-week year after week 37, that pace implies 166,530 additional filings. Adding that to the 2025 year-to-date total of 396,814 yields a year-end estimate near 563,344. If instead the 13-week average of 10,984 were used for 15 weeks, the implied addition would be about 164,760, placing the total near 561,574.
  10. Extending the multi-year pattern suggests continued weekly growth beyond 2024. Average weekly filings progressed from 7,275.17 (2022) to 8,560.73 (2023) to 9,687.19 (2024) and 10,724.70 so far in 2025. The compound average growth rate from 2022 to 2025 weekly means is roughly 13.8%. Applying 13.8% to the 2025 weekly mean of 10,724.70 implies a 2026 weekly mean near 12,205.79. If that weekly pace held for 52 weeks, it would imply on the order of 634,701 filings annually, compared to the 563,344 estimate for 2025.

Gemini Advanced Analysis of the Bankruptcy Statistics

  • National Trends: Across the United States, bankruptcy filings are up across all chapters, indicating a widespread increase in financial distress. Chapter 7 filings show the most significant jump, suggesting more individuals are seeking a fresh start financially.
  • Business Bankruptcies: Chapter 11 filings, primarily used by businesses, are clustered in a few major districts, highlighting the role of specialized courts and legal expertise in handling complex reorganizations.
  • Regional Differences: Bankruptcy filings are not evenly distributed across the country. Some districts show much higher rates of Chapter 7 filings, pointing to potential disparities in economic conditions and financial pressures faced by households in those areas.
  • Urban vs. Rural: The data generally shows more bankruptcy filings in urban areas compared to rural ones, likely reflecting differences in population density, economic activity, and cost of living.
  • Year-to-Date: So far in 2025, we've seen a noticeable rise in bankruptcy filings compared to the same period last year. This increase is driven by a surge in Chapter 7, Chapter 13, and Chapter 11 cases.
  • Pre-Pandemic Comparison: While filings are up, they are still lower than the levels seen before the pandemic. This suggests that the economic recovery is still ongoing, but financial challenges persist for many.
  • Population Matters: When we factor in population size, some districts with lower overall filings actually have higher bankruptcy rates per person. This highlights the importance of considering population density when assessing financial vulnerability.
  • Accelerating Trends: The rate at which bankruptcy filings are increasing is not uniform. Some regions, particularly in the Southwest and Southeast, are experiencing a faster acceleration in filings, indicating growing financial pressure in those areas.
  • Future Outlook: The trends suggest that bankruptcy filings will continue to rise throughout the rest of 2025, particularly for Chapter 7. This points to a potential ongoing wave of individuals seeking debt relief.
  • Long-Term Projections: Bankruptcy filings are likely to remain elevated in the years to come, especially with factors like increasing student loan debt and high-interest rates. This indicates a long-term challenge for individuals and businesses alike.

Subscribe to the Data-Driven BankruptcyWatch Report

Loading...
newsletter