*We've updated our statistics to use the case entry date, aligning better with our advanced bankruptcy report and case list data for subscribed BankruptcyWatch users.
Our Analysis of the Bankruptcy Statistics (Updated August 25th, 2025)
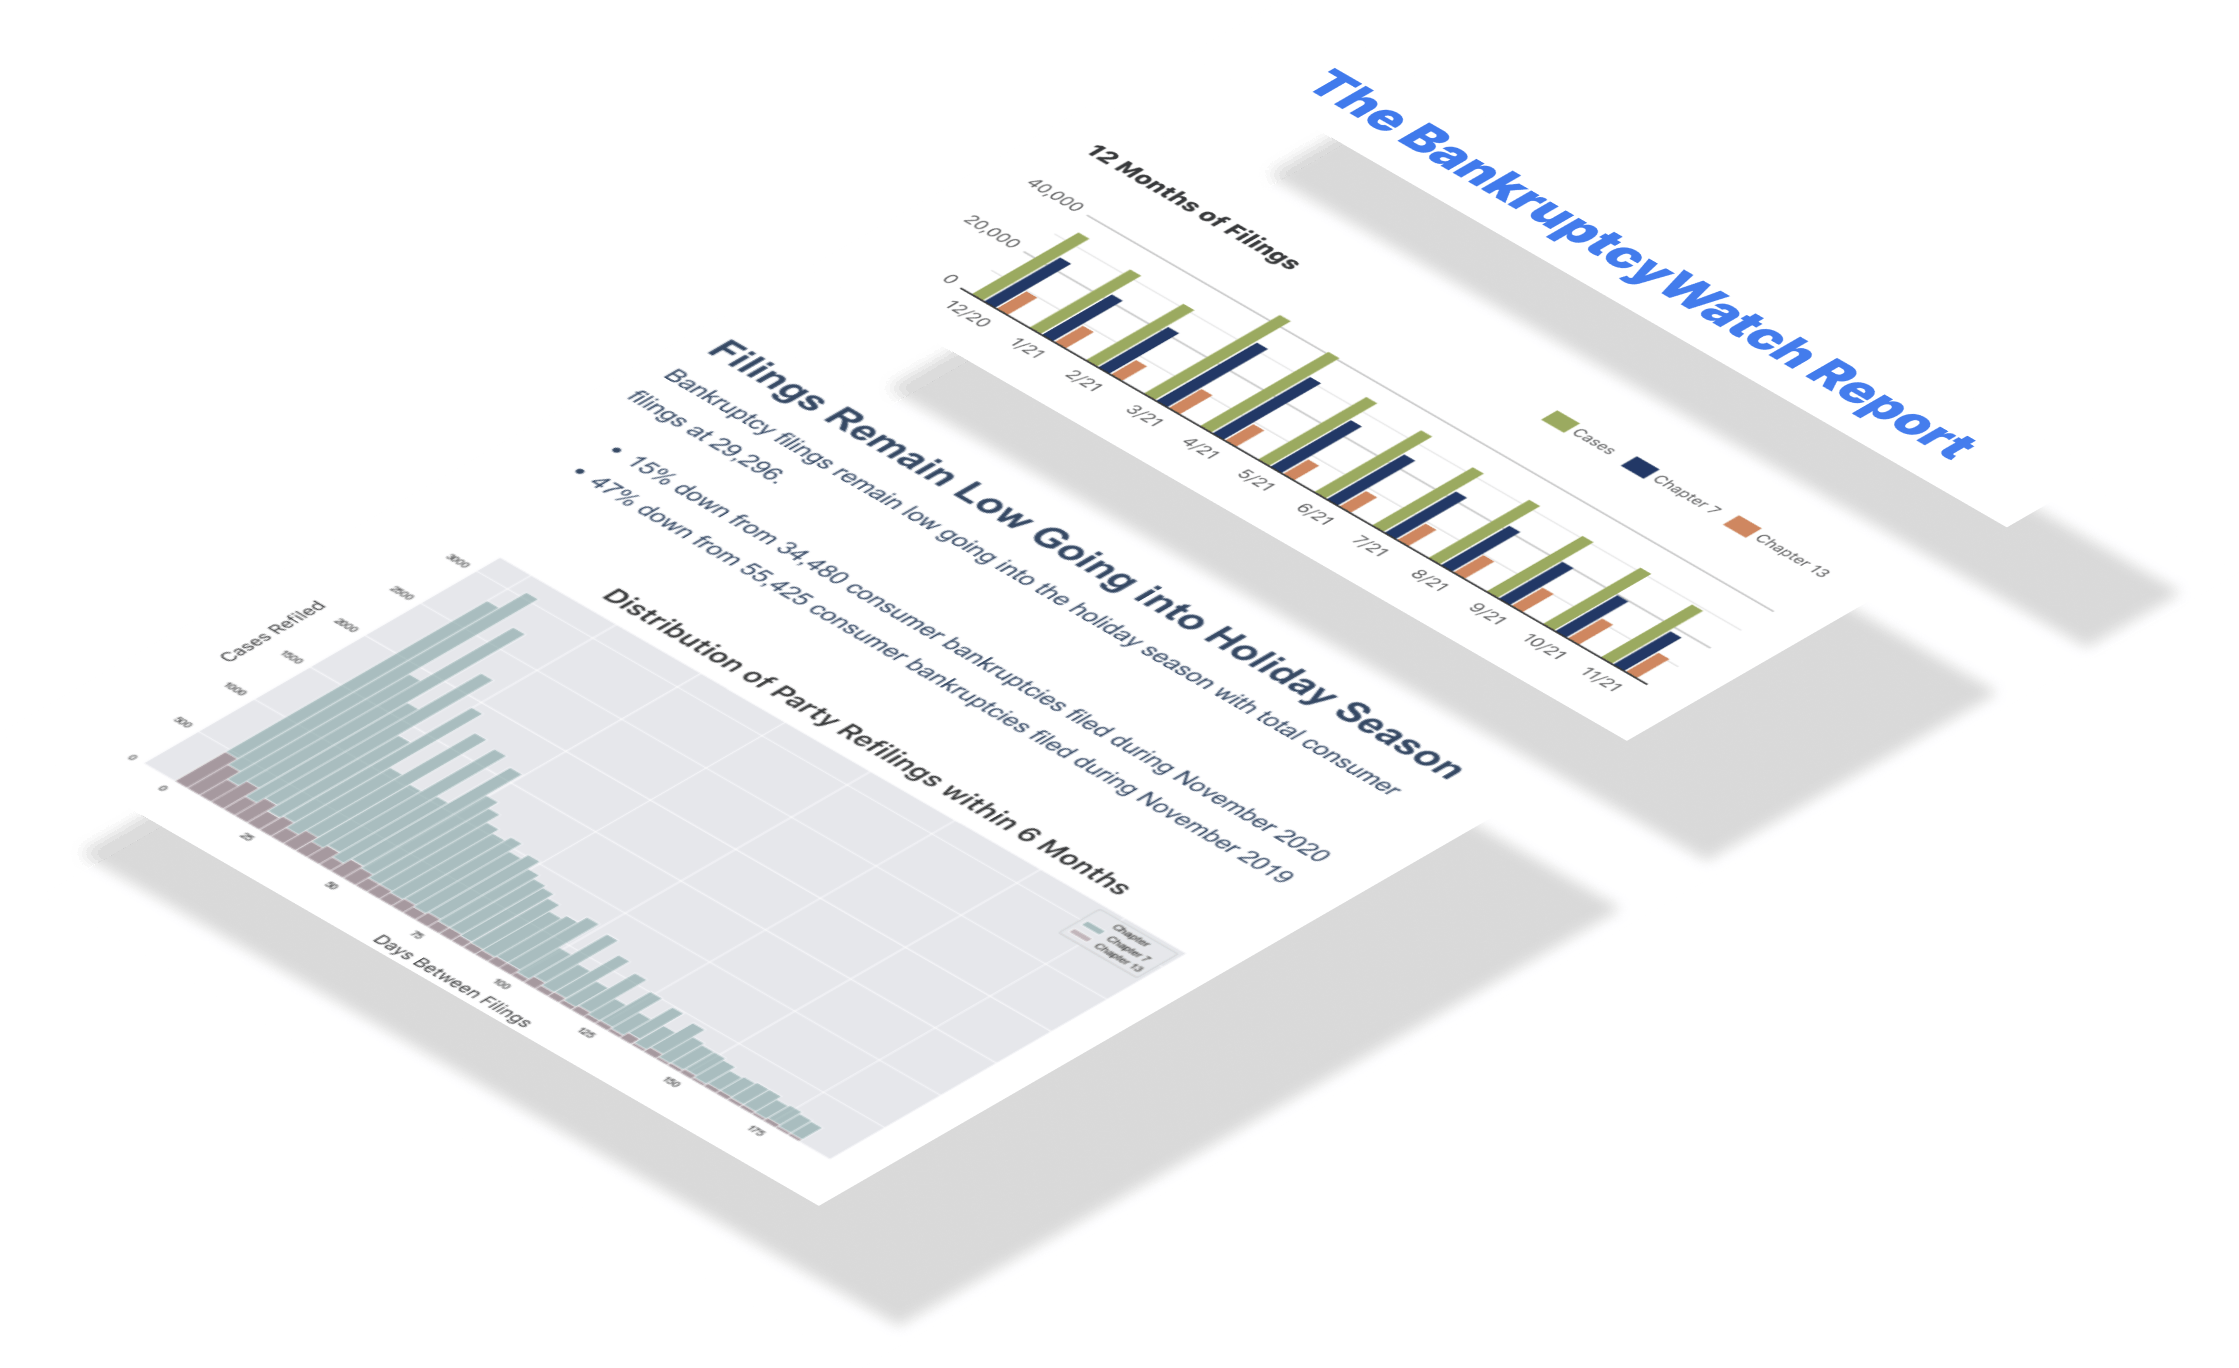
Weekly bankruptcy filings posted a dramatic year-over-year increase through Week 34. Chapter 7 filings, a lifeline for many struggling households, were up 12.14% year-over-year (6,102 in 2024 to 6,843 in 2025). Chapter 13 filings, allowing individuals to restructure their debt, were up 7.73% year-over-year (3,583 in 2024 to 3,860 in 2025). Chapter 11 filings, often used by businesses dealing with insolvency, were up 75.00% year-over-year (112 in 2024 to 196 in 2025).
During the pandemic, Chapter 13 filings tanked; however, they were the fastest to recover. Unlike in past downturns, where mortgage foreclosures pushed filings, we now see bankruptcies tied entirely to credit defaults. Where nearly half of U.S. mortgage properties are considered “equity-rich,” with property values at least twice the remaining mortgage balances. Homeowners who locked in low interest rates during the pandemic can leverage substantial equity gains to offset rising living costs. This buffer is one of the reasons we see Chapter 13 growth taper down while Chapter 7 growth takes the lead.
The current trajectory of bankruptcy filings is on a steep climb. Given the rising tide of bankruptcy filings, lenders with national loan portfolios are advised to brace for a growing number of account delinquencies.


