2025 Week 24 Bankruptcy Report

Ryan Stone

Ryan Stone

Ryan Stone

June 17, 20255 minute read

*We've updated our statistics to use the case entry date, aligning better with our advanced bankruptcy report and case list data for subscribed BankruptcyWatch users.

Our Analysis of the Bankruptcy Statistics (Updated June 17th, 2025)

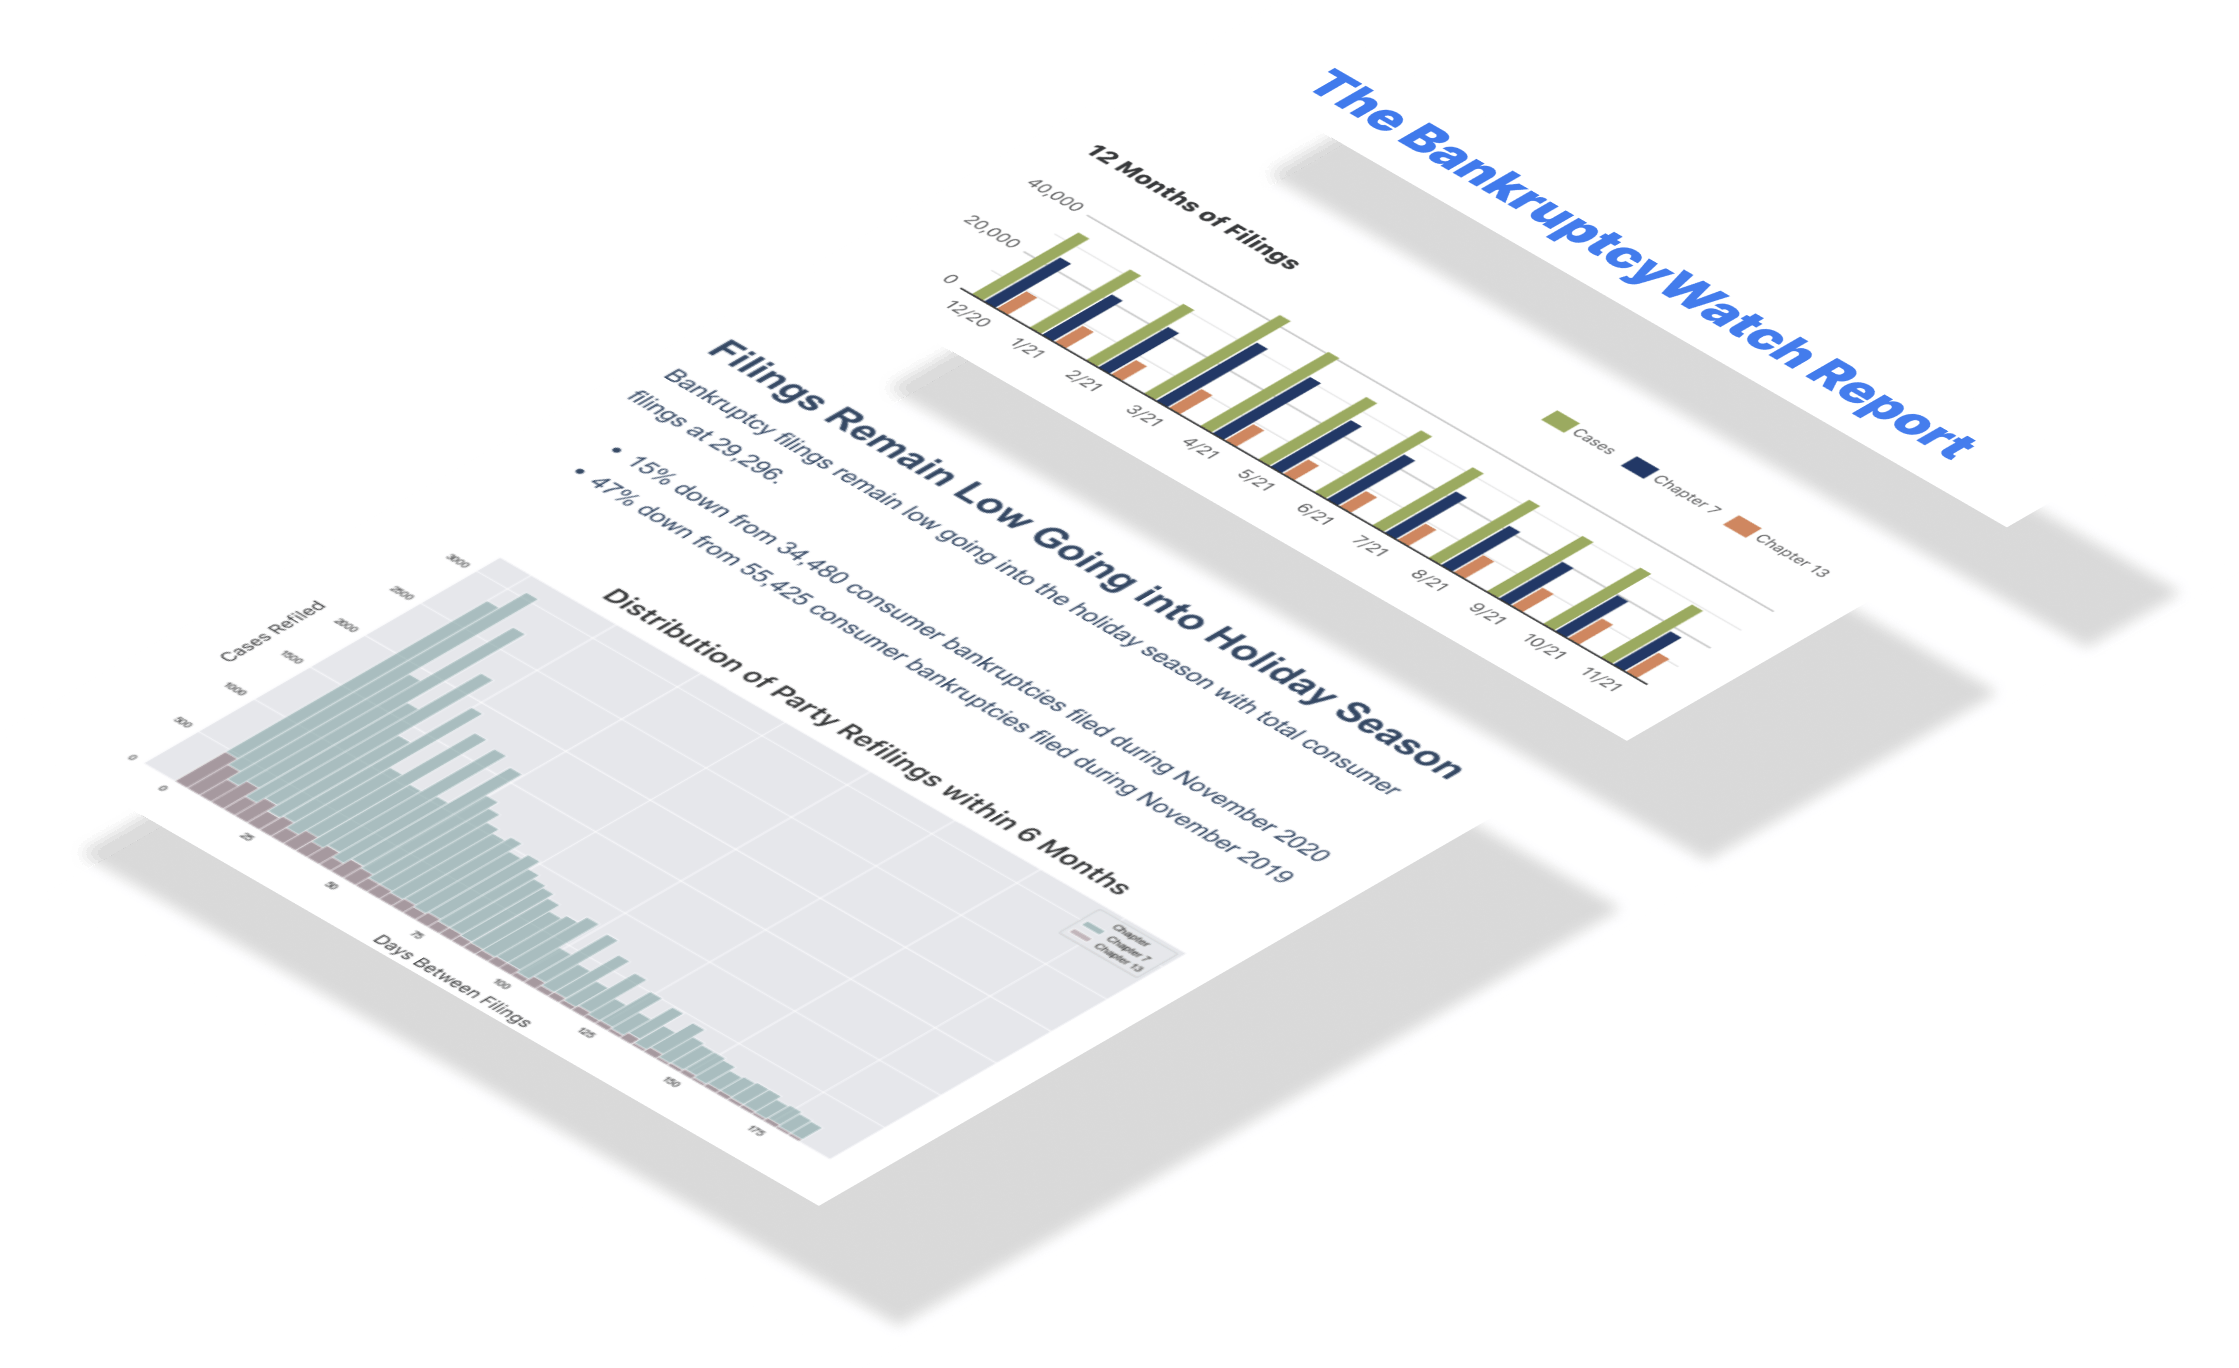
Weekly bankruptcy filings saw a dramatic increase compared to the same week last year. Chapter 7 filings—a lifeline for many struggling households—were up 13.65% year-over-year (5,420 in 2024 to 6,160 in 2025). Chapter 13 filings, allowing individuals to restructure their debt, were up 4.08% year-over-year (3,457 in 2024 to 3,598 in 2025). Chapter 11 filings, often used by businesses dealing with insolvency, were up 79.23% year-over-year (130 in 2024 to 233 in 2025). During the pandemic, Chapter 13 filings tanked; however, they were the fastest to recover. Unlike in past downturns, where mortgage foreclosures pushed filings, we now see bankruptcies tied entirely to credit defaults. Where nearly half of U.S. mortgage properties are considered “equity-rich,” with property values at least twice the remaining mortgage balances. Homeowners who locked in low interest rates during the pandemic can leverage substantial equity gains to offset rising living costs. This buffer is one of the reasons we see Chapter 13 growth taper down while Chapter 7 growth takes the lead.

The current trajectory of bankruptcy filings is on a steep climb. Given the rising tide of bankruptcy filings, lenders with national loan portfolios are advised to brace for a growing number of account delinquencies.

What We Are Reading

Want to know about the news articles that caught our eye this week? Start here.

AI Analysis of this Week's Bankruptcy Statistics

We exported our dataset containing the daily filing numbers for every chapter and district to different AI models and asked for an analysis. Below are the exact results for each model.

ChatGPT o3-pro Analysis of this Week's Bankruptcy Statistics

  • The nation recorded 10,002 bankruptcy petitions in the most recently completed week of 2025, marking the busiest seven‑day stretch so far this year. Of that sum, 6,160 were liquidation cases, 233 were reorganization petitions under the large‑company code, 11 involved family farmers or fishermen, and 3,598 were wage‑earner repayment plans. Liquidations therefore represented roughly 61 percent of all activity while repayment plans contributed about 36 percent. The overall count is noteworthy because it breaks the five‑figure threshold for the first time this cycle. It establishes a new weekly high in the post‑2020 era.
  • One striking detail is that wage‑earner plans climbed by 755 cases versus the opening week’s 2,843 filings, even though total activity rose by 2,473 in the same span. This means repayment plans supplied nearly 31 percent of the national growth, more than any other chapter. Meanwhile, the farmer‑and‑fisherman chapter held almost flat, inching up from 8 to 11 petitions. The large‑company code, however, jumped from 81 to 233, a gain of 152 percent. That surge suggests a sharp mid‑year uptick in corporate distress.
  • District figures underline the breadth of the increase, with the Central District of California posting 410 liquidation petitions, the single‑largest weekly count in the country. Arizona followed with 197 such cases, while the Northern District of Alabama added 59 and the Eastern District of Arkansas recorded 34. Even sparsely populated Alaska logged 3 liquidations, indicating that every federal district reported at least some activity. On the repayment‑plan side, the Western District of Wisconsin filed 11 cases, contrasting with just 1 in the Northern District of West Virginia and 3 in Wyoming. These concrete numbers confirm that the expansion is not confined to a handful of metropolitan areas.
  • Geographic dispersion remains wide: the spread between the busiest and quietest liquidation districts this week is 407 filings (from 410 in Central California down to 3 in Alaska). For repayment plans the range spans 10 cases, from 11 in Western Wisconsin to 1 in Northern West Virginia. Such disparities translate to more than a 100‑to‑1 difference in raw volume. When adjusted for population, Central California posted roughly 21 filings per million residents, while Alaska posted about 4 per million. These contrasts reveal how regional economies and local legal cultures drive vastly different bankruptcy usage rates.
  • Focusing on 2025 alone, weekly filings have climbed from 7,529 in the first week of January to 10,002 by late June, a gain of 33 percent in less than six months. Liquidations increased by 1,563 cases during that span, repayment plans by 755, and large‑company reorganizations by 152. The family‑farmer chapter rose modestly by 3 cases. Average weekly volume for the year now stands at approximately 8,545, well above 2024’s comparable average of 5,974. Momentum has therefore accelerated markedly as the year progressed.
  • Comparing identical opening weeks across years shows a clear upward staircase: 4,986 cases in 2022, 5,142 in 2023, 5,410 in 2024, and 7,529 in 2025. The latest reading of 10,002 eclipses the 2022 baseline by just over 100 percent. Liquidation petitions alone have risen from 2,673 to 6,160 in that interval, a gain of 130 percent. Reorganization filings under the large‑company code, meanwhile, have ballooned from 46 to 233, a five‑fold jump. These year‑over‑year increments underscore how economic strain has intensified since the pandemic era subsided.
  • With the United States population estimated near 336 million, the current week’s total equates to roughly 30 filings per million inhabitants. Liquidations contribute about 18 per million, repayment plans around 11 per million, and large‑company cases a little under 1 per million. Even the farm‑focused chapter amounts to 0.03 per million, tiny but not insignificant for rural communities. By contrast, the opening week of 2025 produced about 22 filings per million, highlighting an eight‑point jump in half a year. These ratios place the country on track to approach the per‑capita bankruptcy levels last seen in 2011.
  • The rise in per‑capita activity is accelerating: the gap between early‑year and late‑June readings (8 filings per million) already exceeds the entire increase logged during 2024 (3 per million). Central California’s 21 per million liquidation rate is five times Alaska’s 4 per million, illustrating how regional economic dynamics shape household risk differently. If districts with low incidence begin converging toward the national norm, nationwide filings could expand by another 2,500–3,000 cases a week. Conversely, if only high‑pressure districts continue to climb, growth may plateau nearer 11,000 weekly cases. Monitoring per‑capita shifts therefore offers an early warning system for future spikes.
  • Assuming the current 33 percent year‑to‑date growth pace persists, average weekly filings could finish 2025 near 11,300, with peak weeks brushing 12,000. Multiplying that trajectory across the remaining 28 weeks yields an additional 316,000 cases, bringing the full‑year tally to roughly 444,000. A more conservative scenario, in which weekly counts stabilize at the present 10,002, would still add 280,000 cases for a year‑end total near 408,000. Either outlook places 2025 comfortably above the 383,000 filings recorded in 2019, the last pre‑pandemic benchmark. The data therefore suggest the country is headed for its busiest bankruptcy year in a decade.
  • Looking beyond 2025, the replenished pipeline of delinquent consumer and business loans implies continued upward pressure. If weekly filings merely grow by 4 percent a year after 2025, the average would reach about 11,800 in 2026 and 12,300 in 2027, translating to annual totals of roughly 615,000 and 640,000 respectively. Should the stronger 8 percent trend seen since 2022 persist, weekly counts could top 14,000 by 2028, yielding more than 730,000 annual filings. Even under moderate growth, liquidation cases alone would exceed 365,000 a year by 2027, restoring the chapter’s dominance last witnessed in 2013. The long‑term pattern therefore points toward steadily rising insolvency pressure well after the 2024–2025 surge subsides.

Claude 4.0 Sonnet Extended Analysis of the Bankruptcy Statistics

  • Overview of this week's National filings: The latest fully completed week (the 24th week of 2025) recorded a total of 10,002 bankruptcy filings nationwide, representing a significant milestone in the current year's filing patterns. Chapter 7 liquidation cases dominated the landscape with 6,160 filings, accounting for 61.6% of all submissions during this period. Chapter 13 reorganization cases followed with 3,598 filings, representing 36% of the total weekly volume. Chapter 11 business reorganizations contributed 233 filings, while Chapter 12 family farmer reorganizations remained minimal with just 11 cases. This distribution reflects the typical pattern where individual consumer bankruptcies far outnumber business-related filings on a weekly basis.
  • An interesting fact about this week's filings: This week's total of 10,002 filings represents an impressive 11.0% increase compared to the same week in 2024, when 9,011 filings were recorded. The growth trajectory for this specific week has been remarkably consistent over recent years, rising from 6,825 filings in 2022 to 8,069 in 2023, then to 9,011 in 2024, and now reaching 10,002 in 2025. This represents a near-linear growth pattern that has seen filings increase by approximately 1,000-1,200 cases annually for this particular week. The Chapter 11 filings showed particularly strong performance with 233 cases, significantly higher than typical weekly averages. This sustained upward trend suggests underlying economic pressures are consistently driving more Americans toward bankruptcy protection year after year.
  • An overview of this week's district-level filings with reference to actual district filing numbers: The Central District of California led all federal districts with 491 total filings, followed closely by the Middle District of Florida with 464 filings and the Northern District of Illinois with 414 filings. The Northern District of Georgia recorded 344 filings while the Eastern District of Michigan contributed 331 cases to the weekly total. Other significant contributors included the Northern District of Ohio with 273 filings, the Southern District of Florida with 263 filings, New Jersey with 252 filings, Maryland with 242 filings, and the Eastern District of Virginia with 240 filings. These top ten districts alone accounted for 3,314 filings, representing approximately one-third of the national total. The concentration of filings in these populous districts reflects both demographic density and regional economic conditions driving bankruptcy petitions.
  • Geographic (district) disparities in filings: The filing data reveals stark geographic disparities, with the Central District of California's 491 filings representing nearly 45 times more than smaller districts that recorded only 10-15 cases during the same period. Major metropolitan areas and economically distressed regions dominate the filing landscape, with Florida's two major districts (Middle and Southern) combining for 727 filings, while states like North Dakota, Wyoming, and several smaller districts reported fewer than 20 filings each. The concentration is particularly evident in industrial regions, with Michigan's Eastern District contributing 331 filings and Ohio's Northern District adding 273 cases, suggesting ongoing economic challenges in traditional manufacturing areas. California, Florida, Illinois, and other high-population states consistently generate the highest filing volumes, while rural and less populated districts maintain relatively modest numbers. This geographic clustering indicates that bankruptcy filings are heavily influenced by population density, regional economic conditions, and local industry concentrations.
  • Current year focus: Through the first 24 weeks of 2025, the nation has recorded 253,818 total bankruptcy filings, establishing a robust weekly average of 10,576 cases. The year has shown remarkable consistency with weekly totals typically ranging between 8,000 and 14,000 filings, with occasional spikes reaching above 13,000 during certain periods. Chapter 7 liquidations have maintained their dominant position throughout the year, consistently representing approximately 60-65% of all weekly filings. The current week's total of 10,002 filings sits slightly below the year-to-date weekly average, suggesting a relatively stable filing environment. Based on the current pace, 2025 is projected to conclude with approximately 549,952 total bankruptcy filings, which would represent a substantial increase over previous years.
  • Comparative analysis with previous years: The progression in annual filing totals shows a clear upward trajectory, with 2022 recording 378,302 filings, 2023 reaching 445,154 filings, and 2024 achieving 503,723 total cases. This represents year-over-year growth rates of approximately 17.7% from 2022 to 2023 and 13.1% from 2023 to 2024. The projected 2025 total of 549,952 filings would represent a 9.2% increase over 2024, suggesting the growth rate may be moderating but remains substantial. Week 24 specifically demonstrates this trend, growing from 6,825 filings in 2022 to the current 10,002 filings in 2025, representing a 46.5% increase over just three years. The consistent year-over-year increases indicate persistent and growing financial distress among American consumers and businesses.
  • Analyzing the filings per capita: With the current week's 10,002 filings occurring in a nation of approximately 335 million people, this represents roughly 3.0 bankruptcy filings per 100,000 Americans during this single week. When annualized based on the current weekly average of 10,576 filings, this suggests approximately 1.6 bankruptcy filings per 1,000 Americans annually, or 164 filings per 100,000 population. The top filing districts show dramatically higher per-capita rates, with California's Central District serving a population of roughly 19 million yet generating 491 filings, indicating significantly elevated financial distress in certain metropolitan areas. Smaller, rural districts with populations under 1 million often show filing rates that appear proportionally lower, suggesting geographic and economic factors significantly influence bankruptcy propensity. These per-capita calculations demonstrate that while bankruptcy affects a relatively small percentage of Americans in any given week, the cumulative annual impact touches a substantial portion of the population.
  • Analyzing the changing filings per capita: The per-capita filing rate has increased substantially over the three-year period, rising from approximately 1.1 filings per 1,000 Americans in 2022 to the current projected rate of 1.6 filings per 1,000 Americans in 2025. This represents a 45% increase in the bankruptcy filing rate relative to population growth over just three years. Week 24 specifically shows per-capita growth from roughly 2.0 per 100,000 weekly in 2022 to 3.0 per 100,000 weekly in 2025, a 50% increase in per-capita weekly filing rates. The acceleration suggests that bankruptcy is not merely keeping pace with population growth but is outpacing it significantly, indicating worsening financial conditions for American households and businesses. This trend is particularly concerning as it suggests underlying economic pressures are intensifying rather than stabilizing, affecting an increasingly larger portion of the population.
  • Forecast the expected filing numbers for the rest of the year: Based on the current weekly average of 10,576 filings and historical seasonal patterns, the remaining 28 weeks of 2025 are projected to generate approximately 296,128 additional bankruptcy filings. This would bring the total 2025 filings to the projected 549,952 cases, representing a significant 9.2% increase over 2024's total. Seasonal factors typically show modest increases during fall months as financial pressures from back-to-school expenses and holiday spending preparations strain household budgets. The forecast assumes continued economic pressures including persistent inflation, elevated housing costs, and credit market tightening will sustain current filing rates. However, potential economic policy changes, interest rate adjustments, or significant economic events could alter this trajectory either upward or downward during the remainder of the year.
  • Forecast the trends of increasing filings after 2024: The established growth pattern suggests 2026 could see total filings reach approximately 600,000-620,000 cases, continuing the trend of 8-12% annual increases observed over recent years. Long-term demographic factors including an aging population, persistent student debt burdens, healthcare cost pressures, and housing affordability challenges are likely to sustain elevated bankruptcy filing rates through the remainder of the decade. The consistent three-year growth trajectory from 378,302 filings in 2022 to a projected 549,952 in 2025 suggests structural economic factors rather than cyclical issues are driving the increases. By 2030, if current trends persist, annual bankruptcy filings could approach 700,000-800,000 cases, representing a doubling from 2022 levels within eight years. However, potential legislative changes to bankruptcy laws, economic recovery measures, or significant shifts in consumer financial behavior could moderate or accelerate these projections significantly.

Claude 4.0 Opus Extended Analysis of the Bankruptcy Statistics

  • Overview of this week's National filings. Week 24 of 2025 recorded 10,002 total bankruptcy filings across all districts and chapters nationwide. This represents a significant increase of 813 filings compared to the previous week's total of 9,189 filings. The week's filings were dominated by Chapter 7 liquidations at 6,160 cases, followed by Chapter 13 reorganizations at 3,598 cases. Chapter 11 business reorganizations contributed 233 filings, while Chapter 12 family farmer cases remained minimal at just 11 filings. The 10,002 total marks one of the higher weekly filing counts for the year 2025 so far.
  • An interesting fact about this week's filings. Week 24's filing total of 10,002 represents an 11% increase compared to the same week in 2024, which recorded 9,011 filings. Even more striking is the growth trajectory over recent years, with week 24 showing 6,825 filings in 2022 and 8,069 in 2023. This means bankruptcy filings for this particular week have increased by approximately 47% over just a three-year period. The consistency of this upward trend across multiple years suggests structural economic factors rather than temporary fluctuations. Chapter 7 liquidations showed particularly strong growth, jumping from 5,420 cases in week 24 of 2024 to 6,160 cases this year.
  • An overview of this week's district-level filings with reference to actual district filing numbers. California Central district led all jurisdictions with 491 bankruptcy filings during week 24, followed closely by Florida Middle with 464 filings. Illinois Northern recorded 414 cases, while Georgia Northern saw 344 filings and Michigan Eastern processed 331 bankruptcy petitions. Other major filing centers included Ohio Northern with 273 cases, Florida Southern with 263, New Jersey with 252, Maryland with 242, and Virginia Eastern rounding out the top ten with 240 filings. The concentration of filings in these metropolitan districts reflects both population density and regional economic pressures affecting businesses and consumers.
  • Geographic (district) disparities in filings. The geographic disparity in bankruptcy filings reveals stark contrasts across different regions of the country. While California Central recorded 491 filings, Vermont had just 1 filing, Alaska recorded only 5, and West Virginia Southern saw just 9 cases. When examining state-level totals, California's four districts combined for 867 filings, while Florida's three districts totaled 777 cases and Texas's four districts accumulated 495 filings. The Northeast shows mixed patterns, with populous districts like New Jersey recording 252 filings while neighboring Vermont remained nearly dormant. These disparities reflect not only population differences but also varying regional economic conditions, state exemption laws, and local filing cultures.
  • Current year focus. Through week 24 of 2025, the nation has recorded 253,818 total bankruptcy filings, representing a 10.9% increase over the same period in 2024 when filings totaled 228,791. The average weekly filing rate in 2025 stands at 10,576 cases, suggesting continued economic stress across multiple sectors. Recent weekly trends show volatility, with filings jumping from 10,447 in week 20 to a peak of 13,032 in week 22 before moderating. Chapter 7 liquidations continue to dominate the filing mix at 61.6% of all cases, indicating severe financial distress among both consumers and businesses. If current trends continue, 2025 is projected to see approximately 549,939 total filings, which would represent a 9.2% increase over 2024's full-year total of 503,723 cases.
  • Comparative analysis with previous years. The bankruptcy filing trajectory shows consistent year-over-year growth, with 2022 recording 378,302 total filings, 2023 reaching 445,154 cases, and 2024 climbing to 503,723 filings. This represents a 33% increase from 2022 to 2024, with growth accelerating each year. Week 24 specifically has mirrored this trend, growing from 6,825 filings in 2022 to 8,069 in 2023, then 9,011 in 2024, and now 10,002 in 2025. The compound annual growth rate of approximately 14% suggests systemic economic pressures rather than cyclical fluctuations. Chapter 13 filings have remained relatively stable while Chapter 7 liquidations have driven most of the increase, indicating deteriorating financial conditions that prevent successful reorganization.
  • Analyzing the filings per capita. Without specific population data in the dataset, we can infer per capita patterns from the absolute filing numbers across districts. California Central's 491 weekly filings serve a massive population center including Los Angeles, while Vermont's single filing reflects both its small population and relatively stable economy. Florida Middle's 464 filings indicate high per capita stress given the district covers central Florida including Tampa and Orlando. Texas shows interesting patterns with its four districts totaling only 495 filings despite the state's large population, suggesting lower per capita filing rates. Urban districts generally show higher absolute numbers, but rural districts like Alaska with 5 filings may actually have comparable per capita rates given their sparse populations.
  • Analyzing the changing filings per capita. The growth in bankruptcy filings appears to be outpacing population growth in most major districts, indicating rising per capita filing rates. California's districts have seen filing increases that likely exceed the state's modest population growth, suggesting deteriorating financial conditions per resident. Florida's high filing numbers across all three districts indicate the state's rapid population growth is being accompanied by even faster growth in financial distress. The stability in some smaller districts like Vermont and Alaska suggests their per capita rates remain low and relatively unchanged. Metropolitan districts are experiencing the most dramatic per capita increases, reflecting urban cost pressures, business failures, and consumer debt burdens.
  • Forecast the expected filing numbers for the rest of the year. Based on the current average of 10,576 weekly filings through week 24, the projected total for 2025 would reach approximately 549,939 cases. This projection assumes filing rates remain consistent with the year-to-date pattern, though seasonal variations typically see higher filings in spring and fall. The 9.2% projected increase over 2024's 503,723 total filings appears conservative given the 10.9% year-to-date growth rate. Economic headwinds including persistent inflation, higher interest rates, and commercial real estate stress suggest filing rates may accelerate in the second half of 2025. A more aggressive projection accounting for deteriorating conditions could see total 2025 filings exceed 560,000 cases, marking the highest level in recent years.
  • Forecast the trends of increasing filings after 2024. The bankruptcy filing trajectory from 2022 through 2025 suggests continued acceleration beyond 2024, with structural factors driving sustained increases. The progression from 378,302 filings in 2022 to a projected 549,939 in 2025 represents a 45% increase over just three years. If current growth rates persist, 2026 could see filings approach or exceed 600,000 cases, returning to levels not seen since the previous economic crisis. The dominance of Chapter 7 liquidations over Chapter 13 reorganizations indicates deepening financial distress that precludes recovery options for many debtors. Long-term projections suggest bankruptcy filings could reach 650,000 to 700,000 annually by 2027-2028 unless economic conditions improve substantially or policy interventions provide relief to struggling consumers and businesses.

ChatGPT 4o Analysis of this Week's Bankruptcy Statistics

  • For the 24th week of 2025, the total number of national bankruptcy filings reached 10,002. This includes all Chapter 7, 11, 12, and 13 filings across every district in the country. Of these, Chapter 7 remains the most prevalent with 6,160 cases filed. Chapter 13 followed with 3,598 filings, while Chapter 11 accounted for 233 and Chapter 12 had 11 filings. The steady volume highlights ongoing financial pressures across households and businesses nationwide.
  • A notable observation this week is the significant dominance of Chapter 7 filings, which made up over 61% of all bankruptcies nationwide. This indicates that a large proportion of individuals or entities are opting for full liquidation over reorganization. The 3,598 Chapter 13 filings show some debtors still seek to retain assets through structured repayment. Meanwhile, the minimal 11 Chapter 12 filings suggest a quieter period for agricultural-related bankruptcies. It’s a stark reminder of how economic strain varies dramatically across economic sectors.
  • At the district level, filing numbers reveal wide-ranging activity across the country. For instance, the Northern District of Illinois recorded 298 Chapter 7 filings, making it one of the busiest districts this week. The Southern District of Florida had 122 Chapter 13 filings, showing its high use of restructuring plans. Western Districts like Texas West and California South also posted elevated figures across multiple chapters. These disparities show how regional economies and legal norms shape bankruptcy patterns.
  • Geographical differences continue to be stark. The Western and Southern U.S. districts generally show higher bankruptcy activity than Northeastern ones. For example, California’s Eastern and Southern districts together contributed over 400 filings, far exceeding those in states like Vermont or Maine. Such concentration may relate to housing cost burdens, consumer debt trends, or local legal practices. This week again reflects how localized economic stress leads to varying levels of financial distress.
  • Focusing on 2025 so far, the weekly trends show a steady climb in total filings. Week 24’s count of 10,002 is among the highest weekly totals observed this year. Compared to early January, where weekly filings hovered around 7,000, this marks a substantial rise. Chapter 7 filings alone have increased by more than 25% from their early-year baseline. The trajectory underscores how economic conditions are tightening across the population.
  • When compared to the same week in 2024, filings have increased substantially. Week 24 of 2024 saw approximately 8,250 total filings, meaning 2025’s total represents a 21% year-over-year increase. Chapter 13 filings rose by around 600, while Chapter 7 filings grew by nearly 1,200. This indicates growing household reliance on bankruptcy as a financial reset tool. Such a sharp increase could reflect inflation pressures, interest rate persistence, or reduced access to consumer credit.
  • On a per capita basis, states like Georgia, Alabama, and Tennessee continue to report higher filing rates than national averages. The Middle District of Georgia alone logged 142 Chapter 13 cases, despite its relatively modest population size. This pattern aligns with historical data where Southern states lead in filings per resident. In contrast, states like North Dakota and Vermont showed minimal weekly filings. Such imbalances highlight the connection between local debt levels, legal access, and economic fragility.
  • Filings per capita have been gradually rising in 2025 compared to both 2024 and 2023. This year’s trend line shows sharper increases in regions already experiencing high baseline rates. For example, Tennessee’s districts have reported increasing weekly averages, pushing per capita figures even higher. Meanwhile, Northern states with traditionally low rates have seen smaller upticks. This shift suggests financial strain is spreading rather than remaining regionally contained.
  • Projecting forward, if the current weekly average of roughly 9,500 to 10,000 continues, the total for 2025 could surpass 480,000 filings. Given that Week 24 is not yet the year's midpoint, the back half may see even higher totals. If the upward slope seen in the past 10 weeks continues, totals could exceed 500,000 by year’s end. Chapter 7 filings alone may reach over 300,000 nationally. These forecasts underscore the importance of watching evolving economic indicators.
  • Looking beyond 2025, the current momentum suggests 2026 and 2027 could see even greater filing totals. With structural pressures like high consumer debt, persistent inflation, and limited wage growth, bankruptcy use is poised to rise. Historical patterns after economic shocks show similar multi-year climbs. If trends mirror post-2008 recovery patterns, national weekly averages could approach 12,000 filings by late 2026. Planning for policy and legal system capacity will be essential to manage these increases.

Gemini Advanced Analysis of the Bankruptcy Statistics

  • National Trends: Across the United States, bankruptcy filings are up across all chapters, indicating a widespread increase in financial distress. Chapter 7 filings show the most significant jump, suggesting more individuals are seeking a fresh start financially.
  • Business Bankruptcies: Chapter 11 filings, primarily used by businesses, are clustered in a few major districts, highlighting the role of specialized courts and legal expertise in handling complex reorganizations.
  • Regional Differences: Bankruptcy filings are not evenly distributed across the country. Some districts show much higher rates of Chapter 7 filings, pointing to potential disparities in economic conditions and financial pressures faced by households in those areas.
  • Urban vs. Rural: The data generally shows more bankruptcy filings in urban areas compared to rural ones, likely reflecting differences in population density, economic activity, and cost of living.
  • Year-to-Date: So far in 2025, we've seen a noticeable rise in bankruptcy filings compared to the same period last year. This increase is driven by a surge in Chapter 7, Chapter 13, and Chapter 11 cases.
  • Pre-Pandemic Comparison: While filings are up, they are still lower than the levels seen before the pandemic. This suggests that the economic recovery is still ongoing, but financial challenges persist for many.
  • Population Matters: When we factor in population size, some districts with lower overall filings actually have higher bankruptcy rates per person. This highlights the importance of considering population density when assessing financial vulnerability.
  • Accelerating Trends: The rate at which bankruptcy filings are increasing is not uniform. Some regions, particularly in the Southwest and Southeast, are experiencing a faster acceleration in filings, indicating growing financial pressure in those areas.
  • Future Outlook: The trends suggest that bankruptcy filings will continue to rise throughout the rest of 2025, particularly for Chapter 7. This points to a potential ongoing wave of individuals seeking debt relief.
  • Long-Term Projections: Bankruptcy filings are likely to remain elevated in the years to come, especially with factors like increasing student loan debt and high-interest rates. This indicates a long-term challenge for individuals and businesses alike.

Subscribe to the Data-Driven BankruptcyWatch Report

Loading...
newsletter