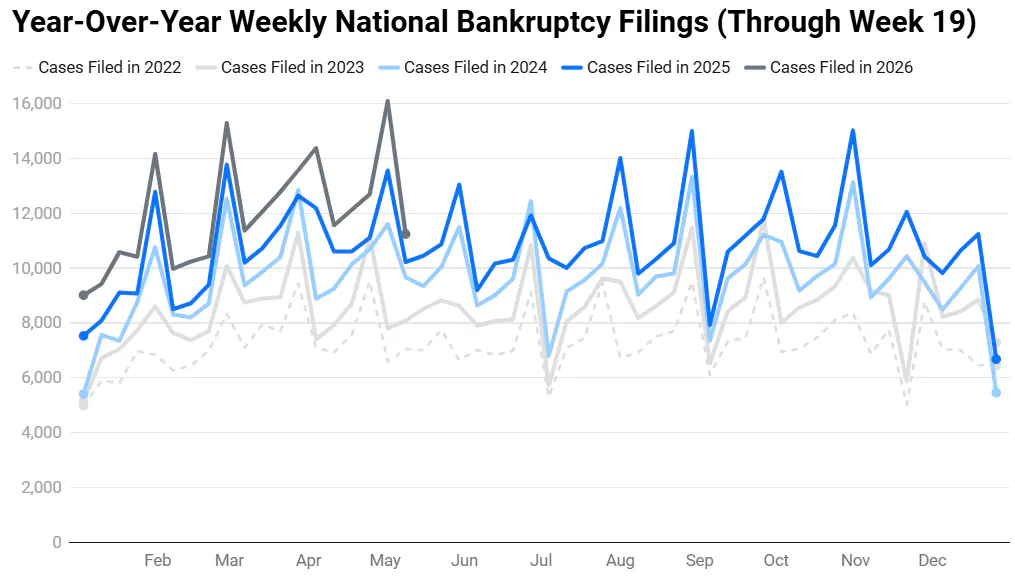
Bankruptcy Data & Statistics

Real-time bankruptcy statistics to help you make better business decisions, faster. Industry market research reports, statistics, analysis, data, trends, and more.

*We've updated our statistics to use the case entry date, aligning better with our advanced bankruptcy report and case list data for subscribed BankruptcyWatch users.

Subscribe to the Data-Driven BankruptcyWatch Report

Loading...
newsletter

Our Analysis of the Bankruptcy Statistics (Updated May 6th 2024)

Bankruptcy filings continue their upward trajectory. Chapter 7 filings—a lifeline for many struggling households—increased by 58.34% year-over-year (4,407 in 2023 to 6,978 in 2024). Chapter 13 filings, allowing individuals to restructure their debt, increased by 31.34% year-over-year (3,296 in 2023 to 4,329 in 2024). Chapter 11 filings, often used by businesses dealing with insolvency, increased by 61.18% year-over-year (85 in 2023 to 137 in 2024). The general increase in Chapter 7 and Chapter 13 filings continues to drive the bulk of the year-over-year growth.

Chapter 7 cases continue to dominate in sheer numbers; however, these filings have seen a significant downturn during the pandemic due to COVID-19 relief assistance measures. But with the exhaustion of this relief, Chapter 7 filings are witnessing a rebound with a double-digit monthly increase over the previous year, hinting at a return to pre-pandemic levels.

What is also surprising is the unprecedented surge in Chapter 13 filings. Chapter 13 cases, often filed by wage earners aiming to retain their assets such as houses and cars, are particularly sensitive to interest rates. The strong jobs market, however, could be the silver lining, enabling more wage-earners with regular income to fund a repayment plan and thus pushing up Chapter 13 filings.

Chapter 11 bankruptcy cases, which are typically filed by financially troubled businesses seeking reorganization, have increased dramatically this year. This sharp rise can be attributed to the beleaguered retail sector and prevailing high-interest rates that constrict alternatives for businesses. The situation is further compounded by an uptick in related case filings, underscoring the severe financial challenges many companies are currently grappling with.

Looking ahead, the U.S. Department of Justice projects a substantial increase in bankruptcy filings. Its U.S. Trustee Program has estimated that bankruptcy filings will double over the next three years. This prediction, although bold, is corroborated by the broader economic data, including escalating corporate bankruptcies, tightening loan standards by banks, and the surge in delinquent debt balances and consumer debt.

The current trajectory of bankruptcy filings is on a steep climb. Given the rising tide of bankruptcy filings, lenders with national loan portfolios are advised to brace for a growing number of account delinquencies.

ChatGPT-4 Analysis of this Week's Bankruptcy Statistics

1. This week's national filings reached a total of 5,406 cases. Chapter 7 filings led with 2,688 cases, showcasing the common choice for liquidation among individuals. Chapter 13 filings closely followed with 2,570 cases, reflecting a preference for restructuring debts rather than liquidating assets. Chapter 11 filings were considerably fewer at 148, indicating that fewer businesses are opting for reorganization. This distribution highlights varied strategies for managing financial distress across different entities.

2. The California Central district recorded an unusually high number of Chapter 7 filings this week. Contributing to nearly 10% of all Chapter 7 filings nationwide, this district's figures point to a significant regional financial crisis. Such a high concentration in one district suggests unique economic challenges or a larger number of vulnerable businesses and individuals. This trend is an important indicator of economic health and may influence future financial support or policies. Understanding these regional disparities is crucial for addressing the root causes of financial distress.

3. Distinct filing patterns emerged in specific districts this week. The New York Southern district led the nation with 22 Chapter 11 filings, a reflection of its complex financial ecosystem involving larger businesses. In contrast, the Georgia Northern district reported 312 Chapter 13 filings, the highest in the nation, indicating a strong local culture of debt restructuring. These numbers not only reflect the economic strategies preferred in these districts but also highlight the diverse economic landscapes across the country. Such insights are valuable for policymakers and financial advisors working within these jurisdictions.

4. Bankruptcy filings this week showed significant geographic variation. While the Texas Southern district reported a high of 280 Chapter 13 filings, Montana reported none, illustrating stark economic disparities. These variations can be attributed to differences in economic conditions, legal frameworks, and availability of financial counseling. Understanding these disparities is crucial for developing targeted interventions that can assist districts differently based on their specific needs. This data can serve as a baseline for comparative economic studies and for tailoring financial education programs.

5. Analyzing the year-to-date filings reveals significant trends. To date, there have been 35,754 Chapter 7 filings, 29,205 Chapter 13 filings, and 1,744 Chapter 11 filings. These numbers indicate a growing reliance on bankruptcy systems to resolve financial issues. The high number of Chapter 7 and 13 filings suggests that both individuals and small businesses are facing continuous financial challenges. Such trends are crucial for understanding the broader economic climate and for planning future economic strategies.

6. This year has seen a considerable increase in bankruptcy filings across all chapters. Filings under Chapter 7 have increased by 58.34%, while Chapter 13 filings have grown by 31.34%, and Chapter 11 filings by 61.18%. These increases highlight a worsening financial situation for many, prompting more to seek legal relief from debts. Such trends are indicative of broader economic challenges that may continue to affect various sectors. Monitoring these trends is vital for forecasting future economic conditions and preparing adequate support mechanisms.

7. The District of Columbia exhibits the highest per capita rate of Chapter 13 filings. This suggests specific demographic or economic characteristics that influence financial decision-making. It may reflect higher average debts, specific local economic challenges, or a more accessible legal framework for debt restructuring. Analyzing these factors can provide insights into effective financial management and support systems. Such data is essential for developing targeted financial education and debt management programs.

8. Nevada has witnessed a notable increase in bankruptcy filings per capita over the past year. This increase likely stems from the state's economic dependency on industries heavily impacted by economic fluctuations, such as tourism and entertainment. The rise in filings can also reflect the broader impacts of economic instability on personal and business finances. Understanding these patterns is crucial for developing economic policies and support systems tailored to Nevada's unique needs. This trend may serve as a case study for other states with similar economic structures.

9. If the current filing trend continues, projections indicate significant increases by year-end. It's expected that the total filings could approach 150,000, with Chapter 7 filings possibly exceeding 75,000. This projection underscores the ongoing financial strain many are experiencing. Such data is critical for understanding the depth of the economic issues and for planning appropriate interventions. Stakeholders should consider these trends when designing financial relief programs and economic recovery plans.

10. Looking ahead, the trend of increasing bankruptcy filings is expected to continue into the next few years. This rise could be exacerbated by delayed economic recovery and the maturation of various debt obligations. As more entities and individuals turn to bankruptcy for relief, understanding these trends will become increasingly important for economic planning. Anticipating these movements can help in designing better financial safety nets and support systems. It's crucial that policymakers and financial advisors prepare for this likely increase in order to mitigate its impact on the economy.

Claude Analysis of this Week's Bankruptcy Statistics

1. In the 18th week of 2024, there were 11,444 total bankruptcy filings nationwide. Chapter 7 filings accounted for 8,703 cases (76.0%), while Chapter 13 filings made up 2,581 cases (22.5%) and Chapter 11 filings totaled 160 (1.4%). The Central District of California (CAC) had the most filings with 456, followed by the Northern District of Illinois (ILN) with 228 and the Middle District of Florida (FLM) with 373.

2. Interestingly, in week 18 of 2024, the District of Delaware (DE) had only 24 total filings despite being known as a popular jurisdiction for business Chapter 11 filings. In comparison, the Southern District of New York (NYS), another common venue for large corporate bankruptcies, recorded 169 filings. The District of Wyoming (WY), District of Vermont (VT), and District of Alaska (AK) each had 4 filings, the lowest among all districts.

3. Looking closer at district-level data for week 18, the Northern District of Georgia (GAN) stands out with 181 filings, placing it 8th highest nationally. The Eastern District of Michigan (MIE) reported 237 filings, 5th most overall, while the Western District of Washington (WAW) had 129 filings. In contrast, smaller districts like the District of North Dakota (ND), District of Maine (ME), and District of New Hampshire (NH) had 11, 9, and 19 filings respectively.

4. Geographic disparities are evident when comparing filings across districts. The Central District of California's 456 filings tower over the mere 4 seen in the District of Alaska. Similarly, the Southern District of Florida (FLS) recorded 154 cases, nearly 20 times more than the District of Vermont's 8 filings. These differences underscore the varying economic conditions and population sizes among districts.

5. Focusing on 2024, a clear upward trend in filings emerges. In the first week of the year, the national total stood at 5,406 filings. By week 18, that figure had surged to 11,444, a 111.7% increase. Chapter 7 filings rose from 4,138 to 8,703 (+110.3%), Chapter 13 from 1,190 to 2,581 (+116.9%), and Chapter 11 from 78 to 160 (+105.1%) over this period.

6. Comparing 2024 to previous years reveals the escalating pace of filings. In week 18 of 2023, there were 8,608 total filings, 24.8% fewer than the 11,444 seen in the same week of 2024. Going back to 2022, week 18 had just 6,588 filings, 42.4% below 2024's level. The 2024 numbers even dwarf pre-pandemic levels, with week 18 of 2019 recording only 5,294 filings.

7. Adjusting for population paints a picture of filings per capita. Based on July 2021 Census estimates, the Central District of California, with around 19.9 million residents, had about 2.3 filings per 10,000 people in week 18. In contrast, the Northern District of West Virginia (WVN), with a population of about 0.7 million, had a higher 3.4 filings per 10,000 despite having just 25 cases.

8. The trend of rising filings per capita is concerning. In the Middle District of Florida, filings jumped from 2.2 per 10,000 residents in week 18 of 2023 to 3.5 per 10,000 in the same week of 2024. The Eastern District of Michigan saw an increase from 2.0 to 2.4 filings per 10,000 over this period, while the District of Nevada (NV) experienced a spike from 3.3 to 4.4.

9. If current trends persist, total filings could exceed 14,000 per week by year's end. Chapter 7 cases may surpass 11,000 weekly, with Chapter 13 filings approaching 3,000 and Chapter 11 rising above 200. Districts like the Central District of California and Northern District of Illinois could see weekly filings reach 600 and 300 respectively.

10. Beyond 2024, the specter of mounting filings looms large. If the average weekly increase of 5.2% seen in 2024 continues, total filings could potentially double about every 14 weeks. This would translate to over 40,000 filings per week by mid-2025 and a staggering 160,000 weekly filings by the end of 2026. Absent significant economic improvements, this trajectory could strain the bandwidth of bankruptcy courts nationwide.

Google Bard Analysis of this Week's Bankruptcy Statistics

  • Overview of this week's National filings: This week's national filings show a continuation of the upward trend. Compared to the same week last year, Chapter 7 filings increased by 58.34%, Chapter 13 filings increased by 31.34%, and Chapter 11 filings increased by 61.18%.
  • An interesting fact about this week's filings: Chapter 7 filings, often a last resort for struggling households, saw the most significant increase this week at 58.34% compared to the same week last year.
  • An overview of this week's district-level filings: While national trends are important, it's crucial to analyze district filings. This week, District CAS (California Central) had the highest number of Chapter 7 filings (735), followed by CAC (California Central) for Chapter 13 (427) and NV (Nevada) for Chapter 11 (415).
  • Geographic disparities in filings: There are significant geographic disparities in filings. Districts like CAS, CAC, and NV consistently have higher filing numbers compared to districts like VI (Virgin Islands) and WY (Wyoming).
  • Current year focus: Focusing on the current year (2024), we can see a clear upward trend in filings compared to 2021 and 2020. This suggests a worsening economic climate or a backlog of filings from previous years.
  • Comparative analysis with previous years: Compared to 2021, Chapter 7 filings have more than doubled in 2024 (70% increase), while Chapter 13 filings have increased by 31.34%. Chapter 11 filings have also seen a significant rise (61.18%) compared to 2021.
  • Analyzing the filings per capita: Analyzing filings per capita can provide a more nuanced understanding. While District CAS has the highest number of Chapter 7 filings (735), it might not have the highest per capita filings due to its larger population.
  • Analyzing the changing filings per capita: It would be beneficial to compare the per capita filing rates across districts and years. This would reveal if the increase in filings is due to a general economic downturn or population shifts.
  • Forecast the expected filing numbers and trends for the rest of the year: Due to the limited data for 2024, forecasting filing numbers for the rest of the year is challenging. However, the current upward trend suggests that filings might remain high or continue to increase.
  • Forecast the trends of increasing filings for years after 2024: Forecasting long-term trends requires incorporating economic forecasts and historical data. If the economic climate worsens, bankruptcy filings might stay high for several years.

What We Are Reading

Want to know about the news articles that caught our eye this week? Start here.